Load Testing Results
Load testing was performed using jmeter. Release Citeck 2024.5. K8S.
Request execution error is considered to be a response time exceeding 10 seconds or a code other than 200. Each thread uses a separate user in the system.
Initially, the system has the following data:
10,000 users
10,000,000 contracts
Testing Scenario
The scenario replicates real requests that occur during user operation.
Scenario composition and load distribution:
login to the system and viewing the main page with loading menu, dashboard, user information (20%);
viewing the contracts journal (30%);
navigating to the contract view page with loading all widgets: contract information, actions, tasks, comments, relationships, version history, etc. (30%);
viewing the active tasks journal (30%);
creating documents (20%);
starting processes for documents (10%);
executing process tasks (50%).
Load Parameters
Name |
Value |
|---|---|
Number of users |
10,000 |
Initial delay, sec |
0 |
Ramp up, sec |
180 |
Hold load, sec |
3,600 |
Ramp down, sec |
180 |
Cluster and Service Resources
5 * (16 CPU, 32 RAM) nodes - Citeck microservices (x2 gateway), postgresql.
Gateway
Pod resources:
resources:
    limits:
        memory: 12Gi
    requests:
        cpu: "8"
        memory: 12Gi
Service configuration:
-Xmx10G -Xms10G

ECOS_WEBAPP_DATA_SOURCES_MAIN_XA_AWARE_MAX_POOL_SIZE: 800
ECOS_WEBAPP_DATA_SOURCES_MAIN_XA_AWARE_INITIAL_SIZE: 800
SERVER_TOMCAT_MAX_THREADS: 6000
ECOS_WEBAPP_WEB_CLIENT_MAXREQUESTS: 500
ECOS_WEBAPP_WEB_CLIENT_MAXREQUESTSPERHOST: 500
Model
Pod resources:
resources:
    limits:
        memory: 13Gi
    requests:
        cpu: "14"
        memory: 13Gi
Service configuration:
-Xmx10G -Xms10G

ECOS_WEBAPP_DATA_SOURCES_MAIN_XA_AWARE_MAX_POOL_SIZE: 800
ECOS_WEBAPP_DATA_SOURCES_MAIN_XA_AWARE_INITIAL_SIZE: 800
SERVER_TOMCAT_MAX_THREADS: 6000
ECOS_WEBAPP_WEB_CLIENT_MAXREQUESTS: 500
ECOS_WEBAPP_WEB_CLIENT_MAXREQUESTSPERHOST: 500
Process
Pod resources:
resources:
    limits:
        memory: 6Gi
    requests:
        cpu: "6"
        memory: 6Gi
Service configuration:
-Xmx4G -Xms4G

ECOS_WEBAPP_DATA_SOURCES_EPROC_MAX_POOL_SIZE: 100
ECOS_WEBAPP_DATA_SOURCES_EPROC_INITIAL_SIZE: 100
ECOS_WEBAPP_DATA_SOURCES_CAMUNDA_MAX_POOL_SIZE: 800
ECOS_WEBAPP_DATA_SOURCES_CAMUNDA_INITIAL_SIZE: 800

ECOS_PROCESS_BPMN_ELEMENTS_MUTATION_PROCESSOR_CONSUMER_COUNT: 8
ECOS_PROCESS_BPMN_KPI_MUTATION_PROCESSOR_CONSUMER_COUNT: 2
ECOS_PROCESS_BPMN_ASYNC_START_PROCESS_CONSUMER_COUNT: 2

SERVER_TOMCAT_MAX_THREADS: 1000
ECOS_WEBAPP_WEB_CLIENT_MAXREQUESTS: 200
ECOS_WEBAPP_WEB_CLIENT_MAXREQUESTSPERHOST: 200
UiServ
Pod resources:
resources:
    limits:
        memory: 6Gi
    requests:
        cpu: "7"
        memory: 6Gi
Service configuration:
-Xmx3G -Xms3G

ECOS_WEBAPP_DATA_SOURCES_MAIN_MAX_POOL_SIZE: 300
ECOS_WEBAPP_DATA_SOURCES_MAIN_INITIAL_SIZE: 300
SERVER_TOMCAT_MAX_THREADS: 2000
PostgreSQL
Pod resources:
resources:
    limits:
        memory: 30Gi
    requests:
        cpu: "15"
        memory: 30Gi
Service configuration:
max_connections = 7000
max_prepared_transactions = 7000
shared_buffers = 8GB
effective_cache_size = 15GB

work_mem = 6MB

max_worker_processes = 15
max_parallel_maintenance_workers = 4
max_parallel_workers_per_gather = 4
max_parallel_workers = 15

max_wal_size = 3GB
min_wal_size = 80MB
Other services had recommended default parameters.
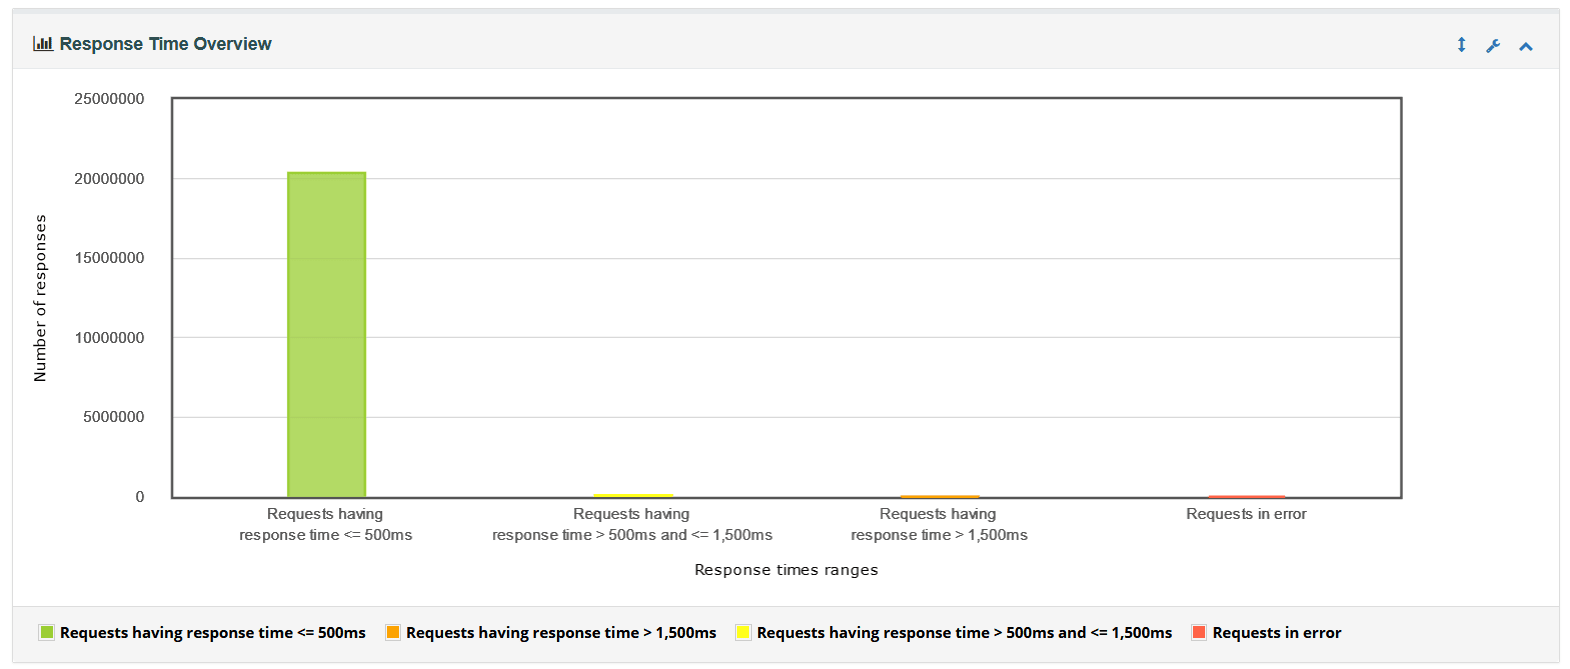
Results
During the load, 20,447,914 requests were generated, of which 221 requests (0.00 %) ended with errors or exceeded the execution time limit.

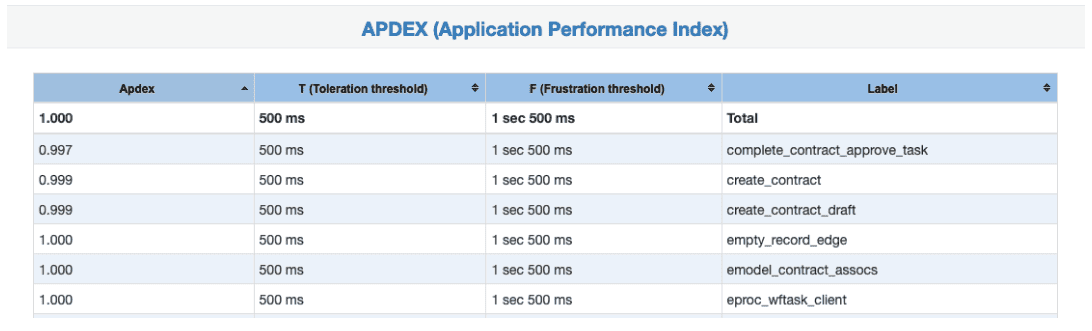
Achieved Metrics
Average response time - 21.88 ms
Median — 6 ms
90% of all requests were processed in less than 18 ms
95% of all requests were processed in less than 34 ms
99% of all requests were processed in less than 73 ms
Response Time / Time

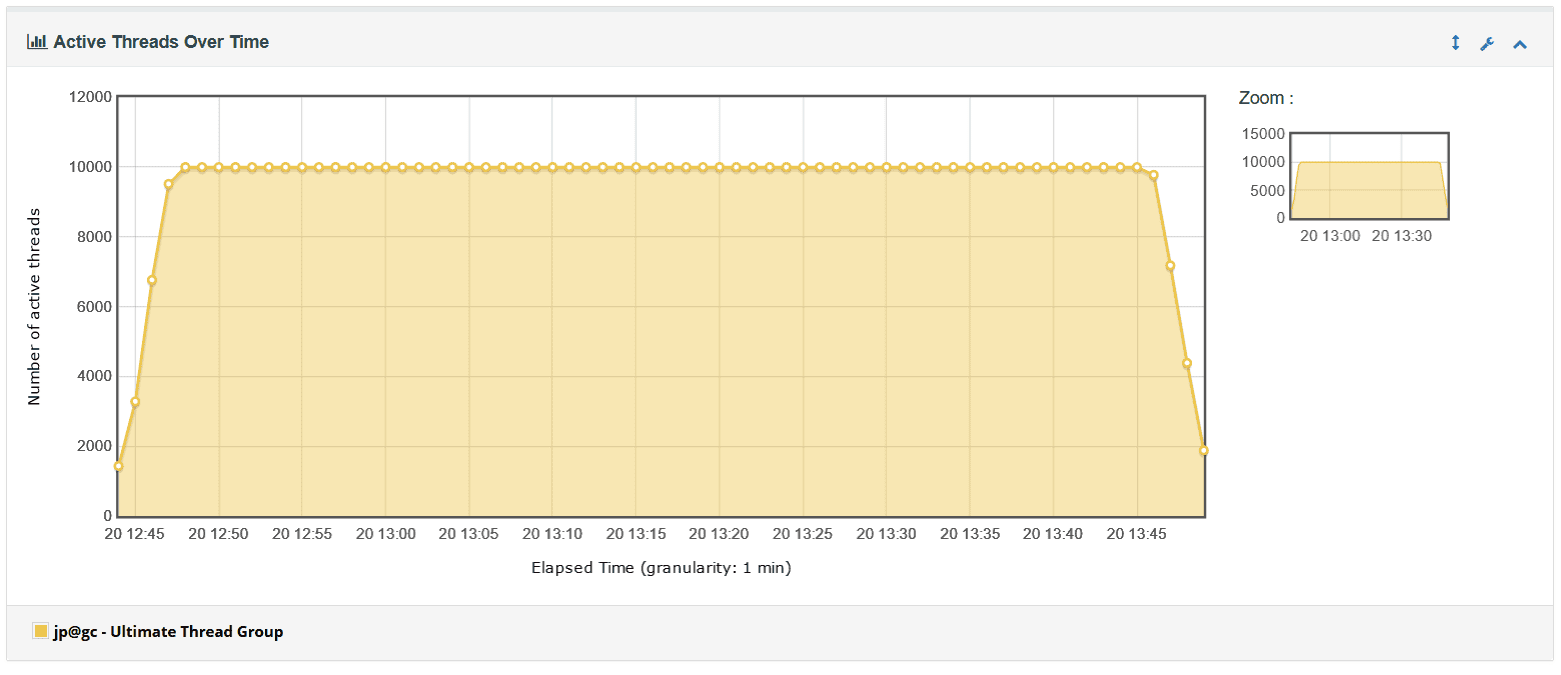
Active Threads / Time
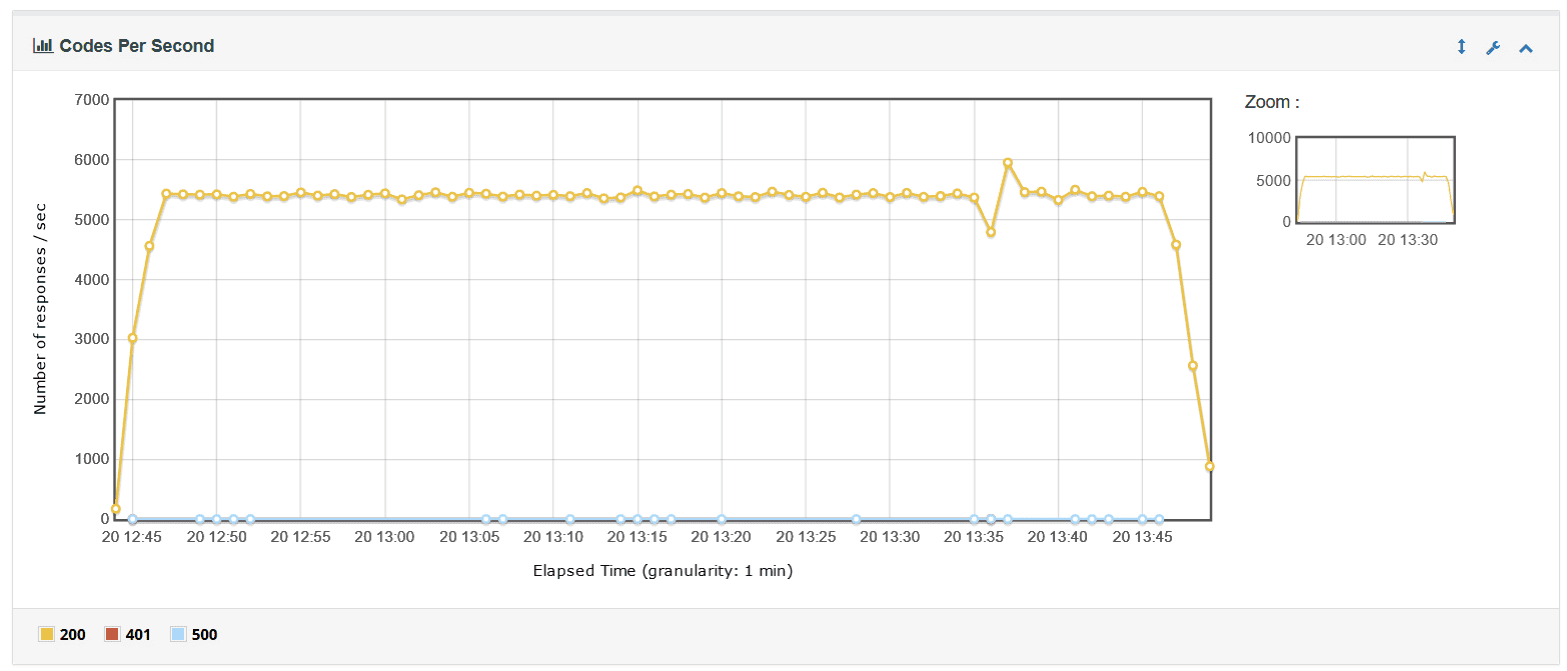
Requests per Second
Most loaded requests:

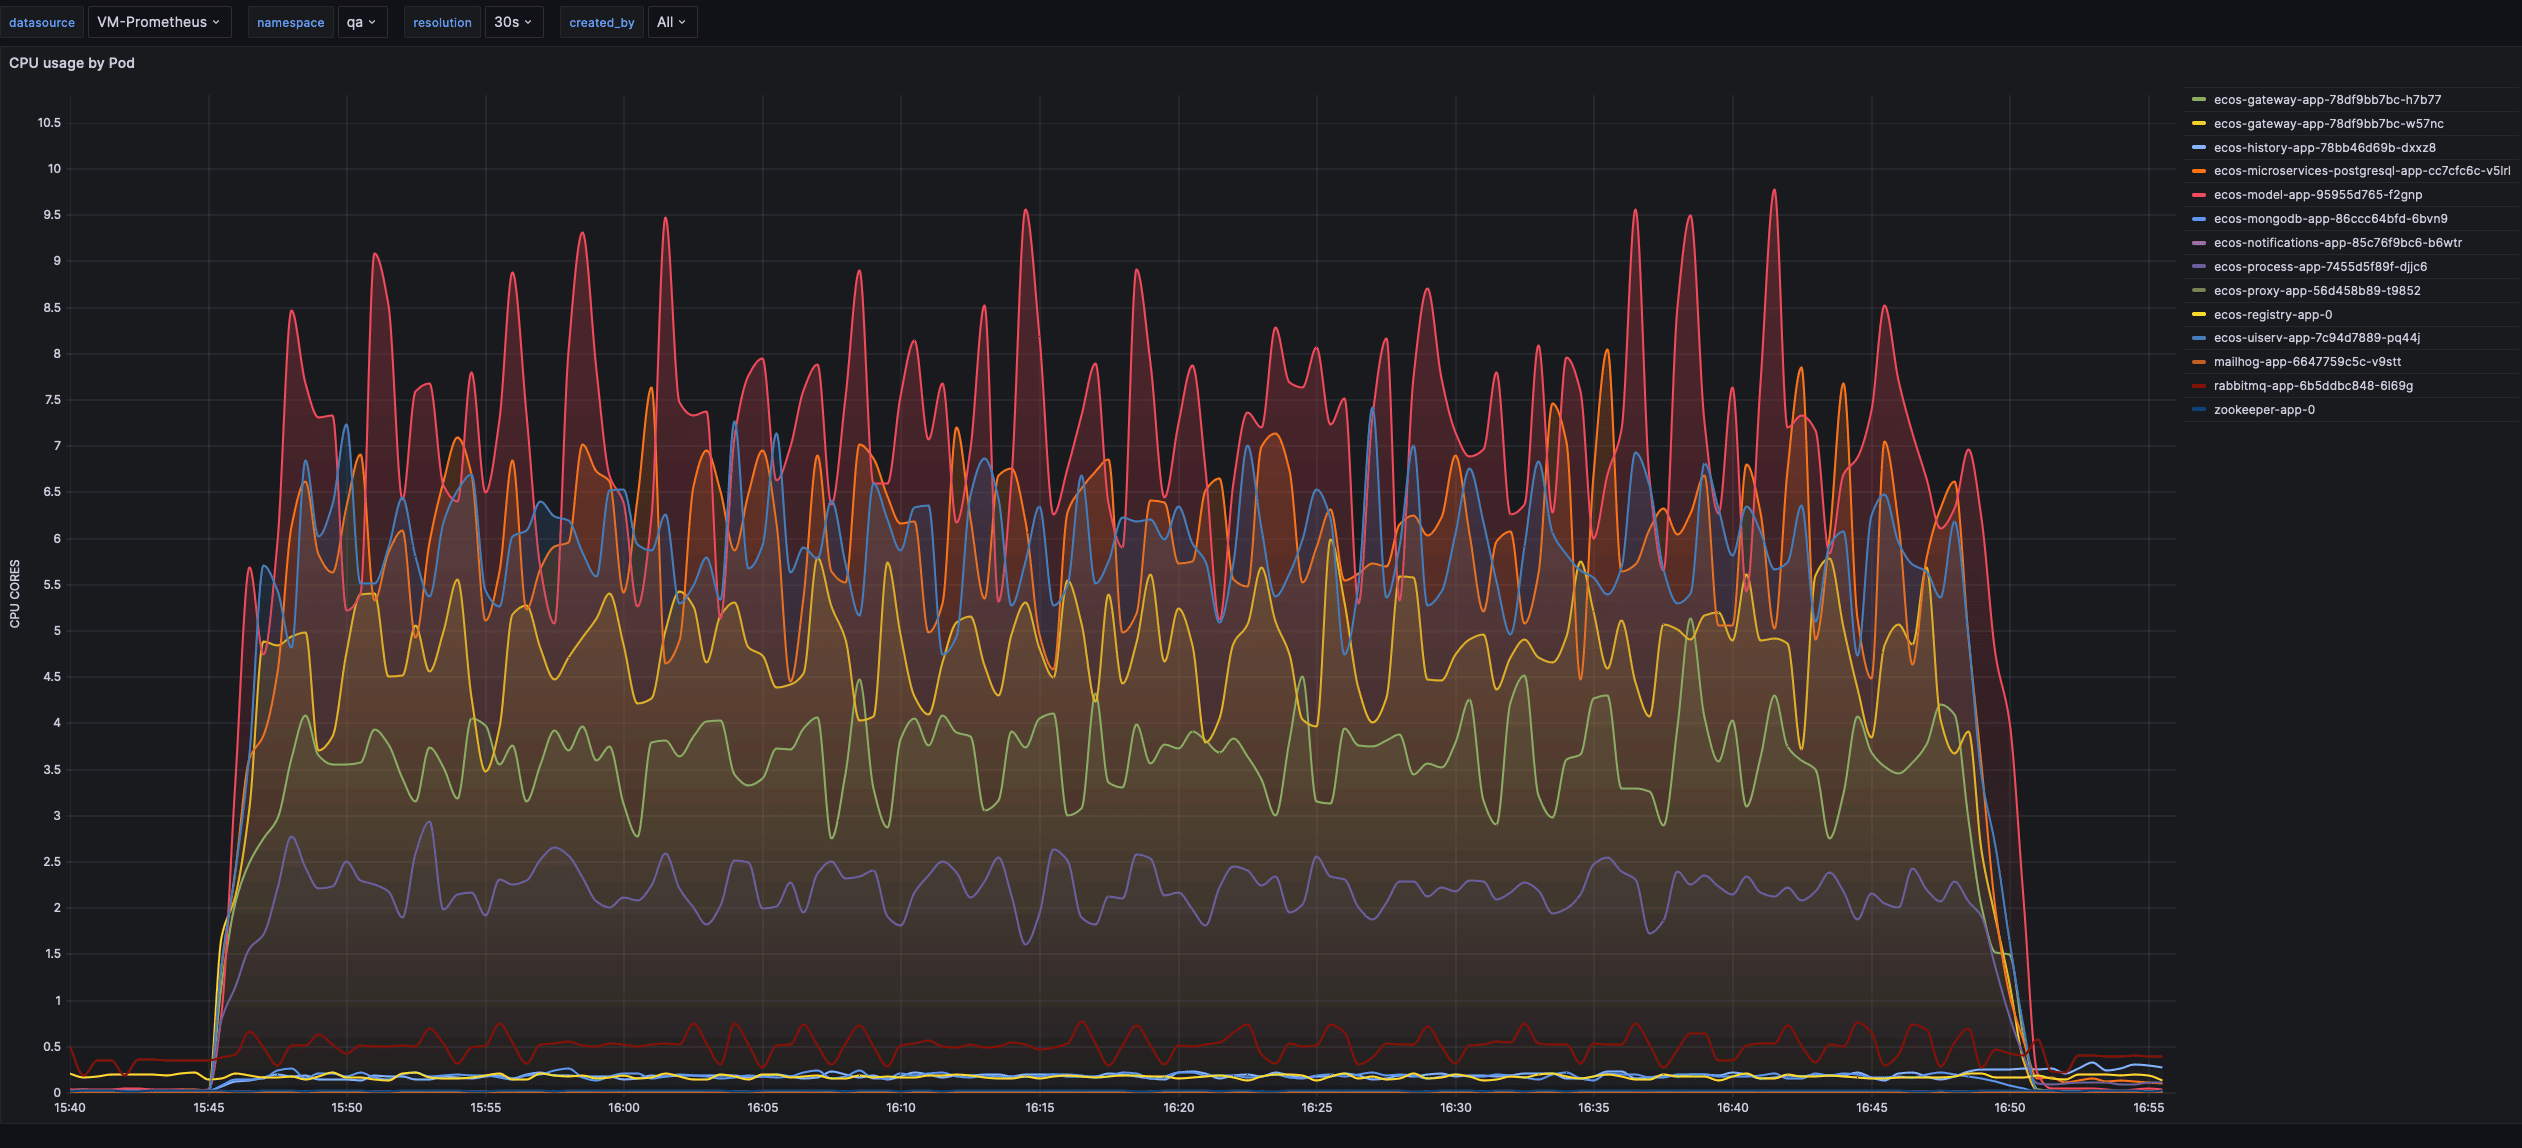
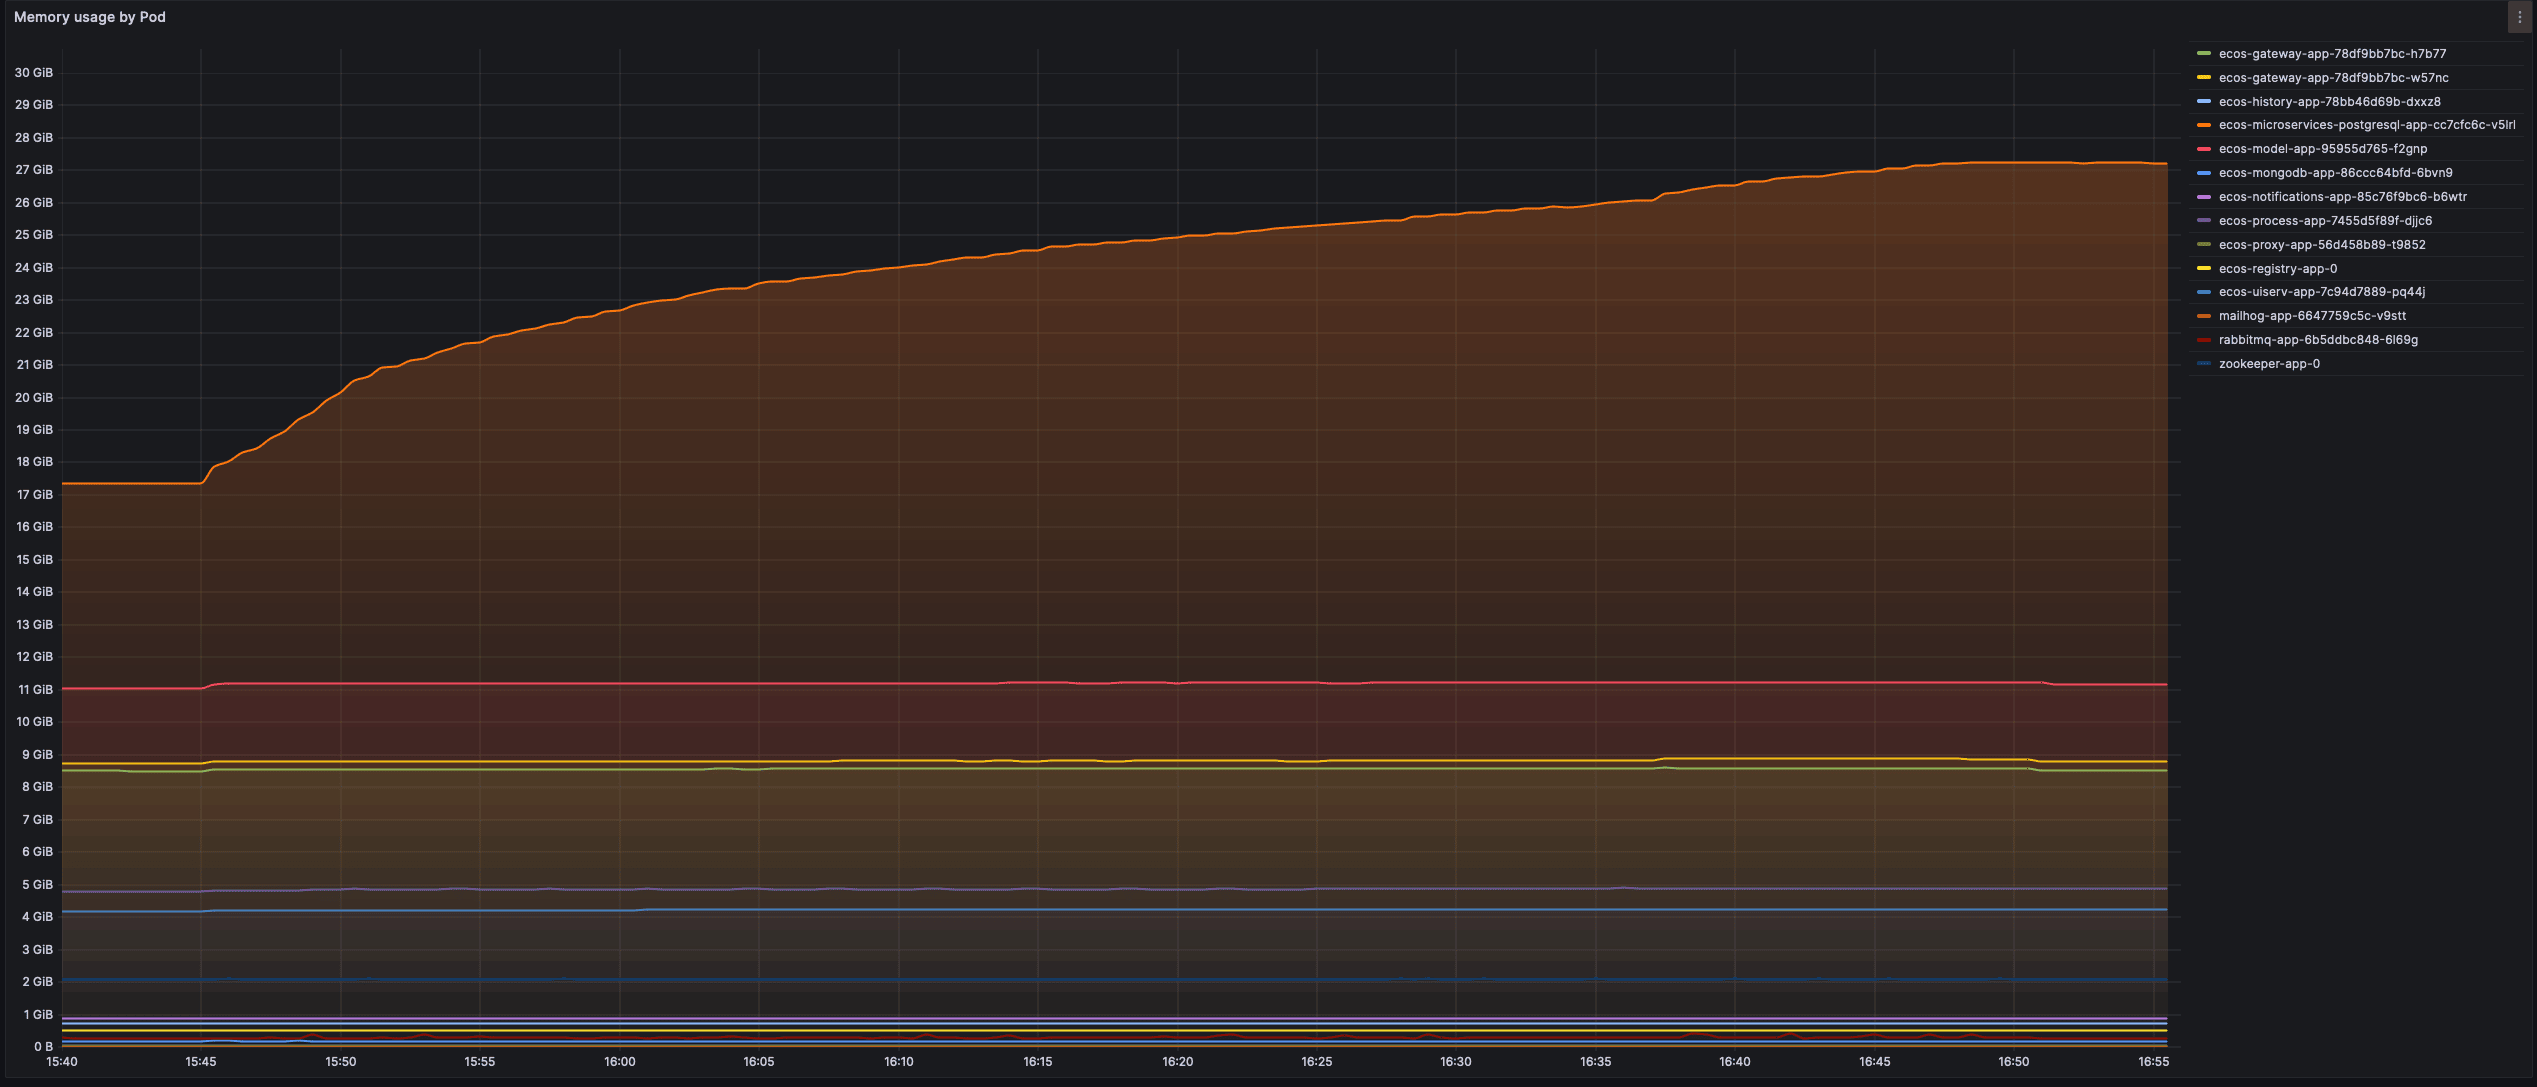
Service load at peak:
Model – 10 CPU (11.5 GB RAM)
PostgreSQL – 9 CPU (27.2 GB RAM)
UiServ – 7.5 CPU (4.3 GB RAM)
Gateway – 6 CPU (9 GB RAM) - per instance
Process – 3 CPU (5 GB RAM)
CPU, RAM Pods Graphs
Load testing was performed using jmeter. Release Citeck 2024.5. K8S.
Request execution error is considered to be a response time exceeding 10 seconds or a code other than 200. Each thread uses a separate user in the system.
Initially, the system has the following data:
1,000 users
10,000,000 contracts
Testing Scenario
The scenario replicates real requests that occur during user operation.
Scenario composition and load distribution:
login to the system and viewing the main page with loading menu, dashboard, user information (20%);
viewing the contracts journal (30%);
navigating to the contract view page with loading all widgets: contract information, actions, tasks, comments, relationships, version history, etc. (30%);
viewing the active tasks journal (30%);
creating documents (20%);
starting processes for documents (10%);
executing process tasks (50%).
Load Parameters
Name |
Value |
|---|---|
Number of users |
1,000 |
Initial delay, sec |
0 |
Ramp up, sec |
180 |
Hold load, sec |
3,600 |
Ramp down, sec |
180 |
Cluster and Service Resources
16 CPU, 32 RAM node with ECOS, PostgreSQL configuration.
Gateway
Pod resources:
resources:
    limits:
        cpu: "2"
        memory: 1Gi
    requests:
        cpu: "2"
        memory: 1Gi
Service configuration:
-Xmx256m -Xms256m
Model
Pod resources:
resources:
    limits:
        cpu: "2"
        memory: 1Gi
    requests:
        cpu: "2"
        memory: 1Gi
Service configuration:
-Xmx256m -Xms256m
Process
Pod resources:
resources:
    limits:
        cpu: "1"
        memory: 4Gi
    requests:
        cpu: "1"
        memory: 4Gi
Service configuration:
-Xmx2G -Xms2G
UiServ
Pod resources:
resources:
    limits:
        cpu: "1"
        memory: 1Gi
    requests:
        cpu: "1"
        memory: 1Gi
Service configuration:
-Xmx256m -Xms256m
PostgreSQL
Pod resources:
resources:
    limits:
        cpu: "2"
        memory: 2Gi
    requests:
        cpu: "2"
        memory: 2Gi
Service configuration:
max_connections = 7000
max_prepared_transactions = 7000
shared_buffers = 250M
effective_cache_size = 1GB

work_mem = 4MB

max_worker_processes = 2
max_parallel_maintenance_workers = 2
max_parallel_workers_per_gather = 2
max_parallel_workers = 2

max_wal_size = 3GB
min_wal_size = 80MB
Other services had recommended default parameters.
Results
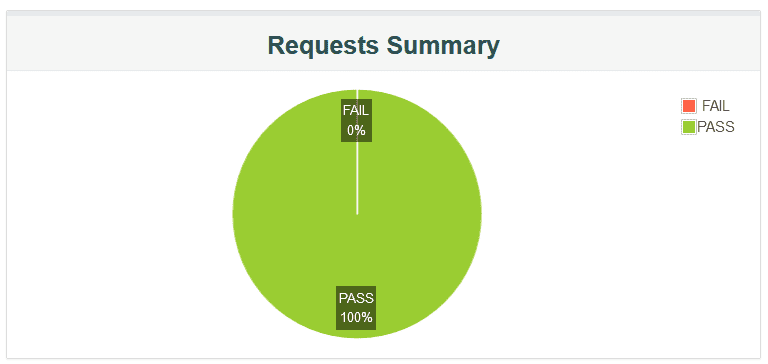
During the load, 2,043,398 requests were generated, of which 1 request (0.00 %) ended with errors or exceeded the execution time limit.
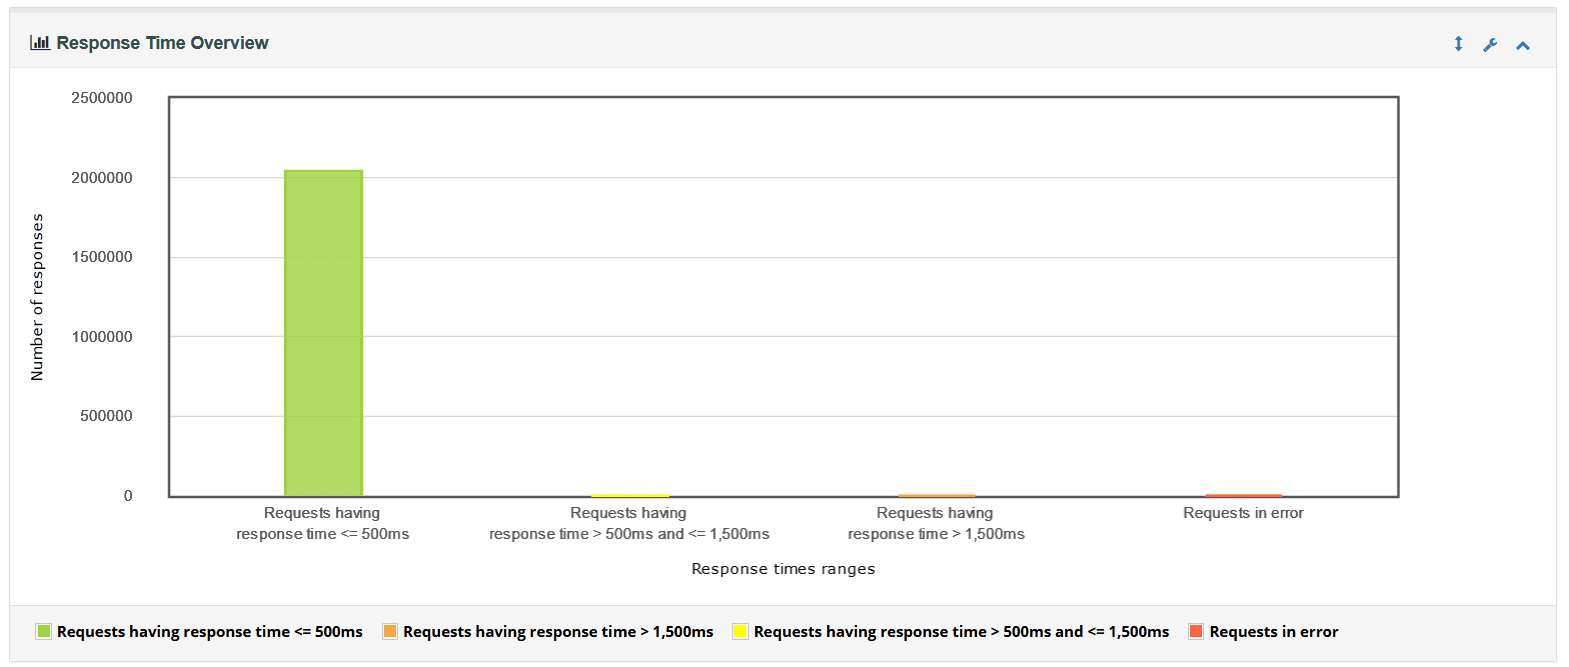
Achieved Metrics
Average response time - 6.88 ms
Median — 6 ms
90% of all requests were processed in less than 16 ms
95% of all requests were processed in less than 25 ms
99% of all requests were processed in less than 47 ms
Response Time / Time

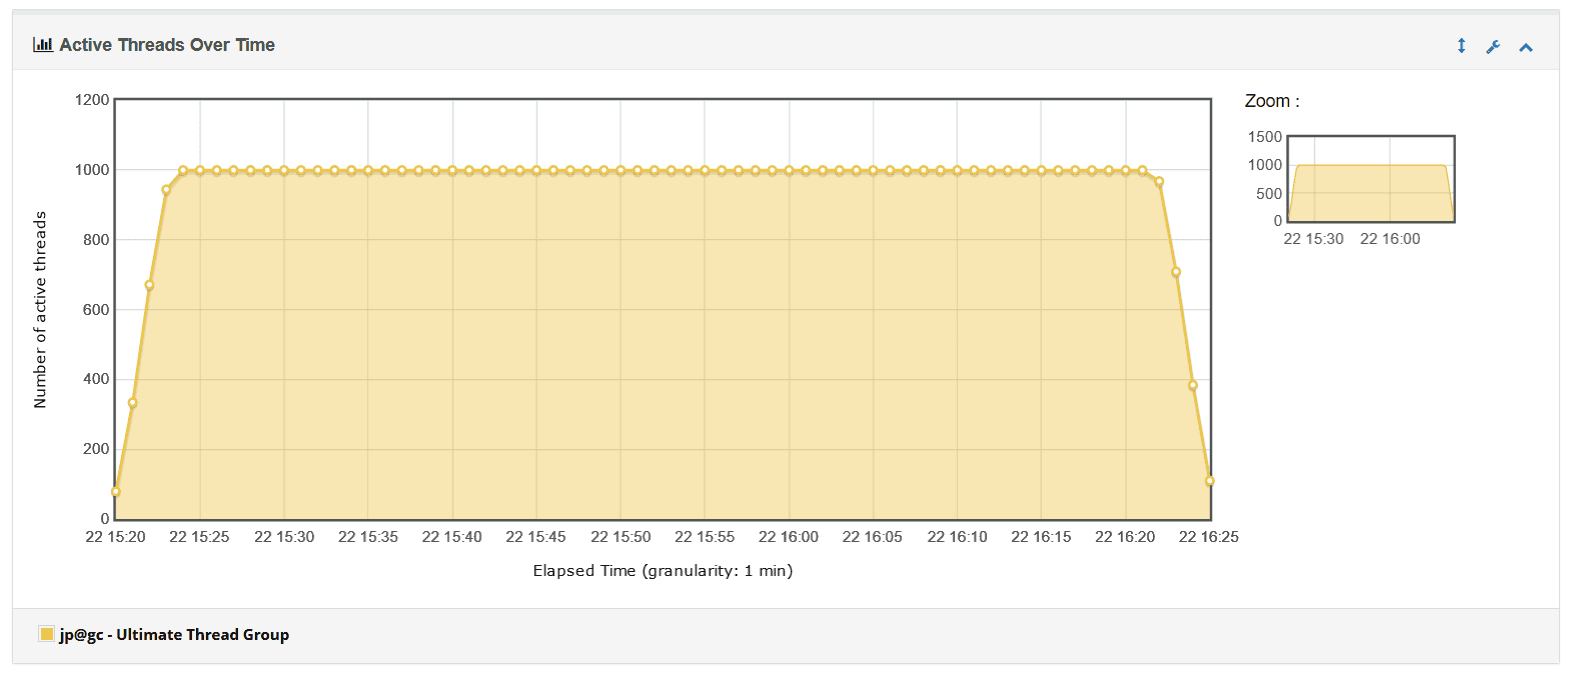
Active Threads / Time
Requests per Second
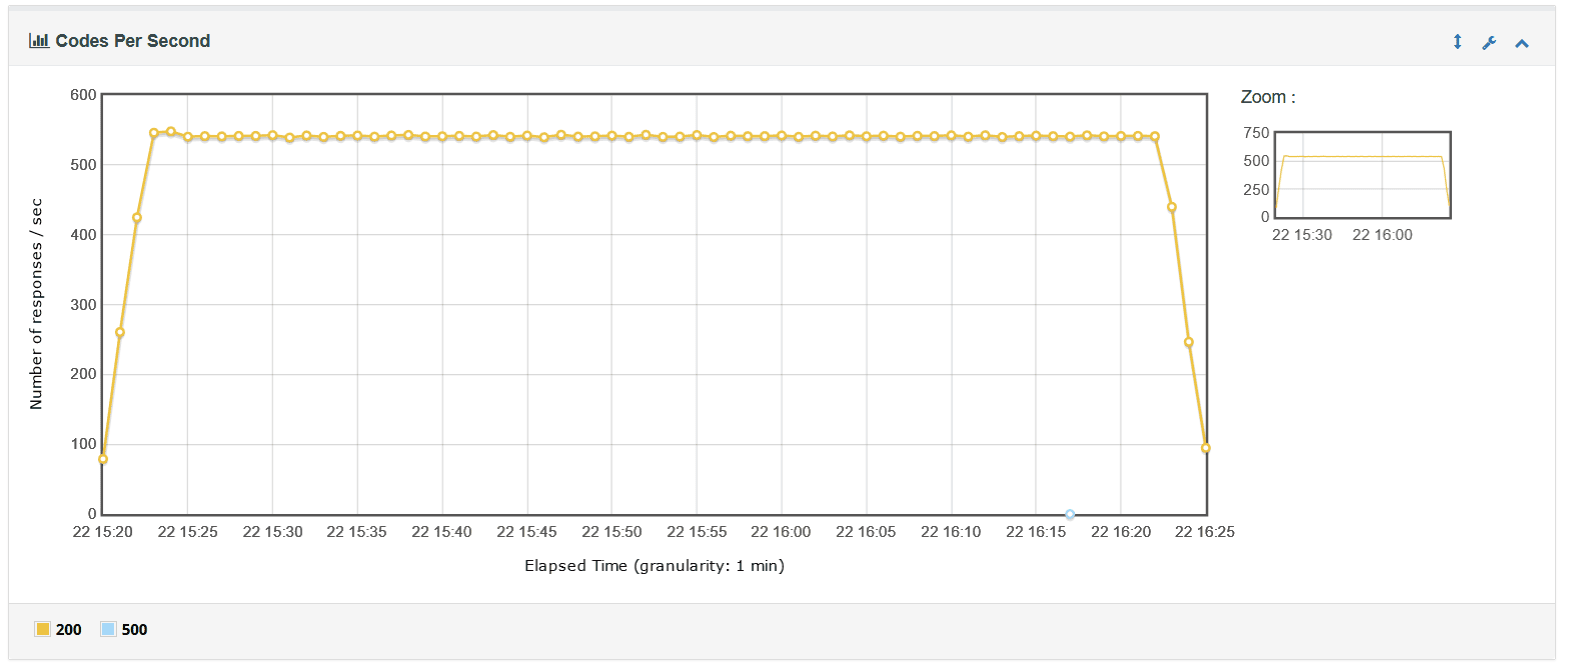
Most loaded requests:
Service load at peak:
Model – 1.5 CPU (700 MB RAM)
PostgreSQL – 1 CPU (1.7 GB RAM)
UiServ – 0.8 CPU (850 MB RAM)
Gateway – 1.3 CPU (750 MB RAM)
Process – 0.5 CPU (2.8 GB RAM)