Dashboards
Dashboards are provided in Citeck to display the user’s home page or case information.
The dashboard allows adding and removing widgets, configuring each widget individually. See separate article widgets
All settings are stored in the same json as the dashboard configuration.
Types of Dashboards
The following types of dashboards exist:
Type/Key |
Description |
|---|---|
case-details |
Case card dashboard - information about the document (tasks, properties, actions, history, etc.).
The dashboard key is taken from the RecordRef in the page URL and is usually related to the ECOS type/kind.
Key formation follows this rule:
type_uuid/kind_
type_uuid
So for contracts it would be:
1. contracts-cat-doctype-contract/contracts-cat-contract-rent
2. contracts-cat-doctype-contract
Order - from highest priority to lowest priority
For example:
host/v2/dashboard?activeTab=0&recordRef=emodel/type-id@local-id |
site-details |
Section page that allows displaying general data for the section.
The dashboard key is taken from the RecordRef in the page URL. At the time of writing, the key is formed by the rule “site” + siteId.
If the site identifier is contracts, then its priority dashboardKey will be site_contracts.
|
user-dashboard |
User’s home page. Opens if no recordRef is specified in the URL.
For example:
host/v2/dashboardThe dashboard key is always DEFAULT unless explicitly specified otherwise (dashboardKey can be specified in the URL)
|
profile-details |
User profile page, accessible from the user account actions menu, item “My Profile” (see Control Panel)
For example:
host/v2/dashboard?activeTab=0&recordRef=emodel/person@username |
ws-dashboard |
Page of workspaces. For example:
- для персонального рабочего пространства:
host/v2/dashboard?ws=user$username- для неперсонального рабочего пространства:
host/v2/dashboard?ws=workspacename |
In links for user-base-type-dashboard, user-dashboard (independently and from org structure) the activeTab parameter is used,
for example, https://host/v2/dashboard?activeTab=0&recordRef=emodel/person@someuser
activeTab=N - active dashboard tab. Tabs are numbered from 0, where 0 is the first tab.
The dashboard search algorithm is as follows:
Check for recordRef in the URL:
If recordRef is absent - a request is sent for the user’s home page configuration.
If recordRef is present, then we request attributes _dashboardKey[] (array) and _dashboardType (single value).
Then we iterate through each received dashboardKey and request configuration from the server for key + type,
If no configuration is found on the server, we try the next dashboardKey,
If no dashboard is found for any key, we request configuration for the DEFAULT key.
Displaying dashboards for workspaces:
For workspaces, the user-dashboard is displayed by default.
For personal workspace, the personal-ws-dashboard-default dashboard is displayed.
For non-personal workspace, the ws-dashboard-default dashboard is displayed.
For corporate portal, the corpport-workspace-dashboard dashboard is displayed.
Caching
Caching is possible within the open browser tab:
_dashboardKey[] and _dashboardType by recordRef (they change quite rarely),
Dashboard configuration (or its absence) by dashboardKey + dashboardType.
Setting editing permissions
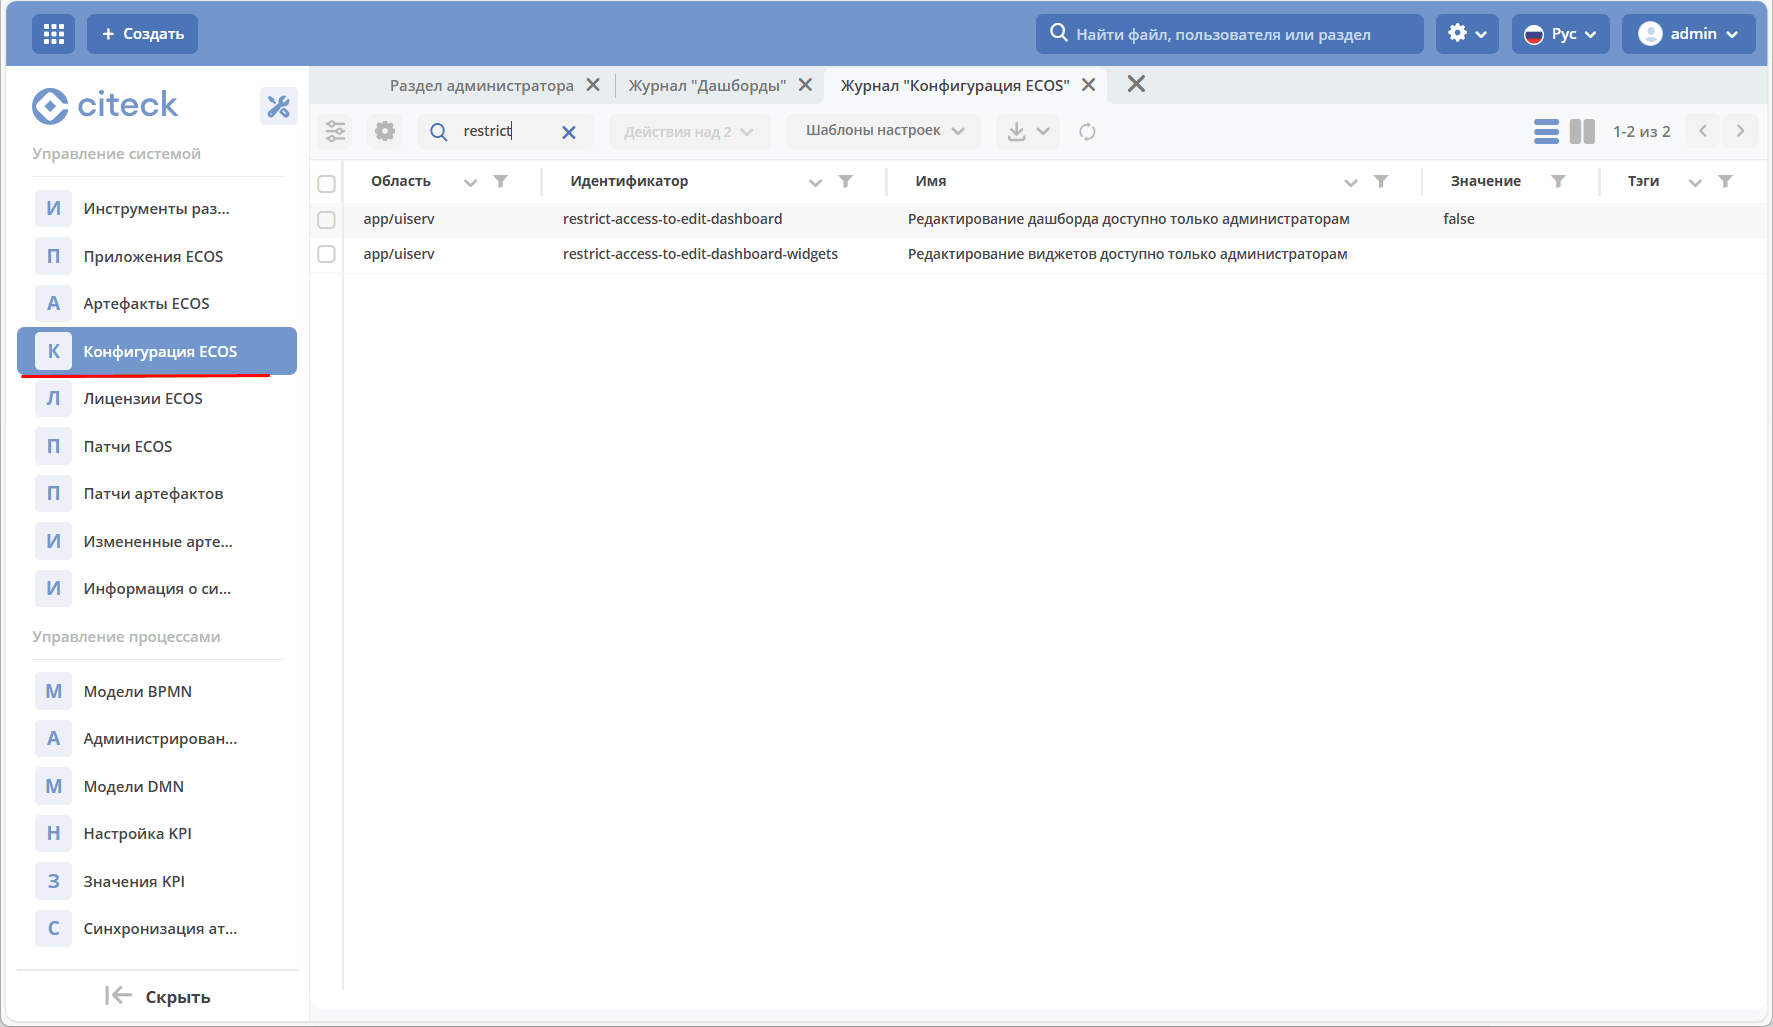
In the system, users can be granted separate permissions for dashboard configuration (restrict-access-to-edit-dashboard) and widget configuration (restrict-access-to-edit-dashboard-widgets).
That is, a user may have rights to configure the dashboard but be prohibited from configuring widgets.
Configs are stored in the System Management – ECOS Configuration section (v2/admin?journalId=ecos-configs&type=JOURNAL):
Enabling the setting:

Dashboard Configuration
When opening a case card, user profile, or home page for the first time, the default dashboard for the corresponding type will be shown.
Dashboard configuration is done directly from the selected data type.
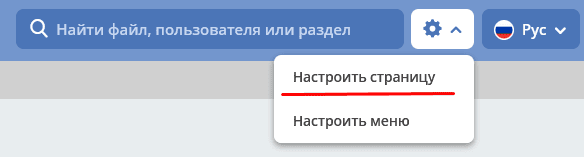
To additionally configure the dashboard - change settings, remove or add widgets, you need to go to the case card, user profile, or home page and click the gear icon -> “Configure page”:
The general configuration form looks like this:
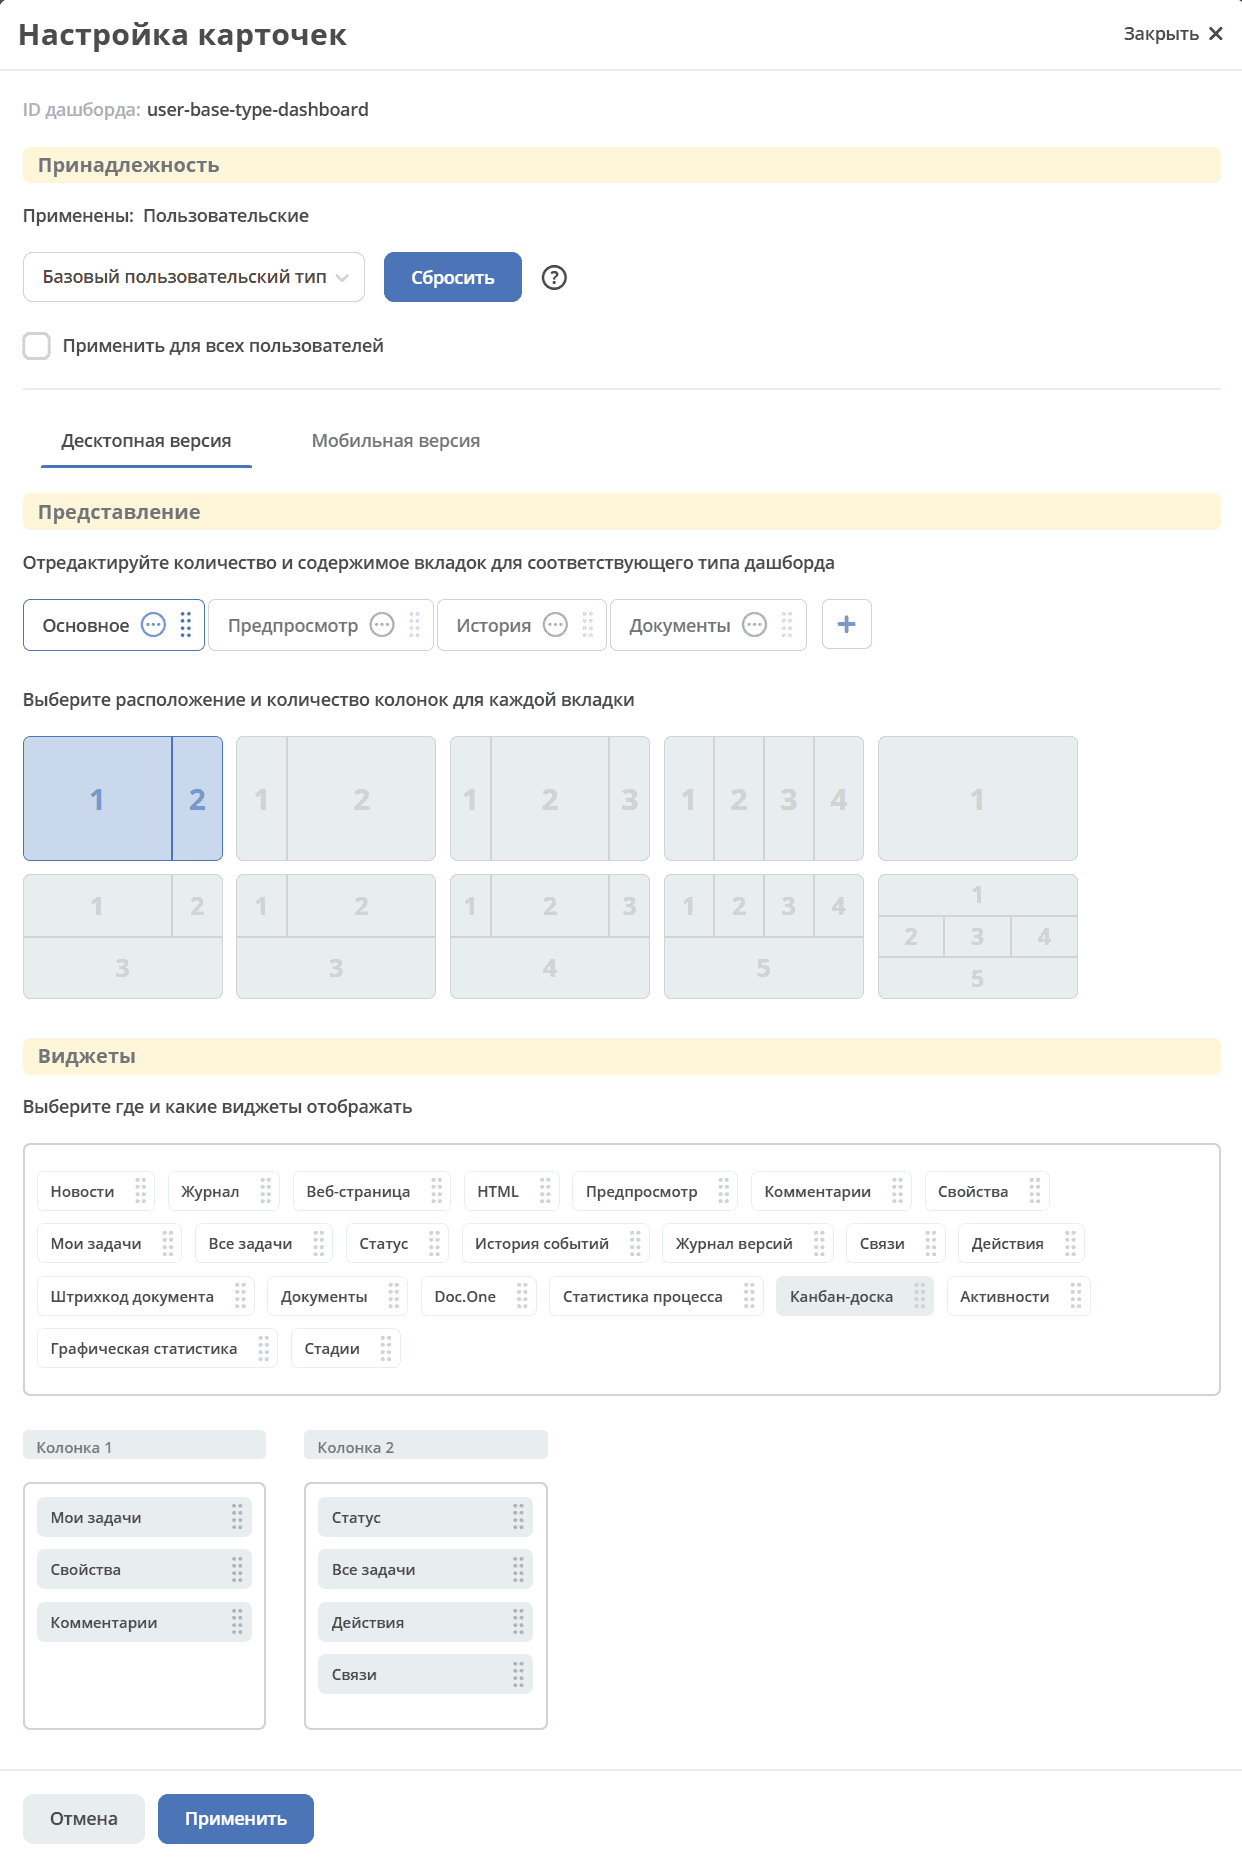
Dashboard Sections
«Ownership»
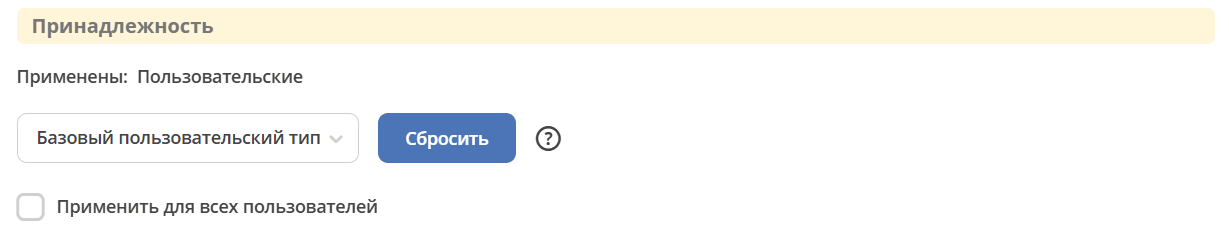
The top section shows the dashboard id and data type for which it is being configured.
The data type can be changed from the available dropdown list. For example:
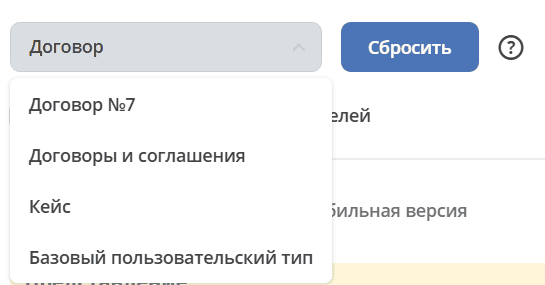
A separate dashboard can be configured for a specific document (if for example you select type “Contract№512”, then when opening this contract’s card, a dashboard configured specifically for this document will be displayed).
With the “Apply to all users” checkbox checked, the configured dashboard will be applied to all users in the first assigned organizational group who open the specified data type.
«View»
Configuration selection is available for desktop or mobile version of Citeck.
Specify the number and content of tabs, select the layout and number of columns for each tab.

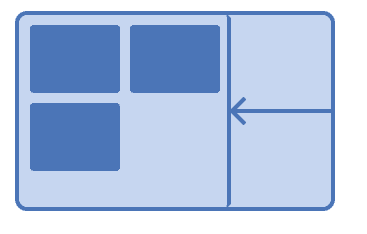
Only for the Site-dashboard type, the following layout is available (Number of columns adjusts to browser window size):
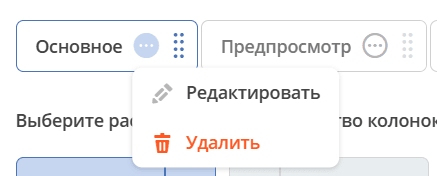
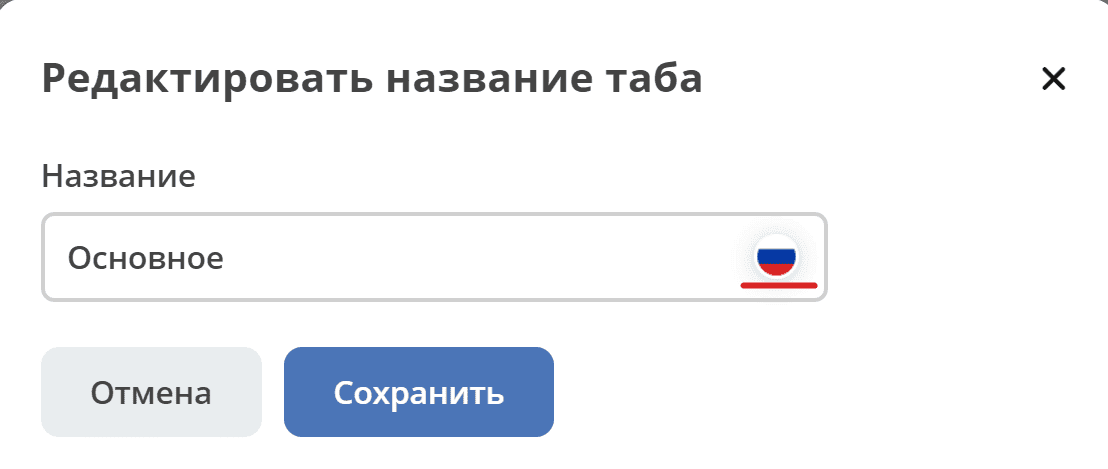
For the Case-dashboard type, multilingual name support is available for tabs:
|
|
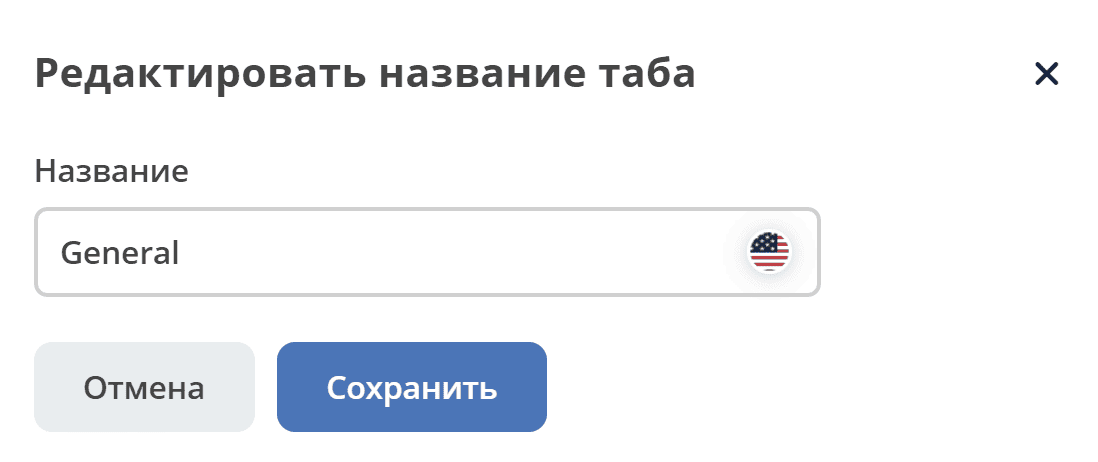
|
Important
For the mobile version, only those widgets that have already been configured for the desktop version and carry the same settings are displayed:
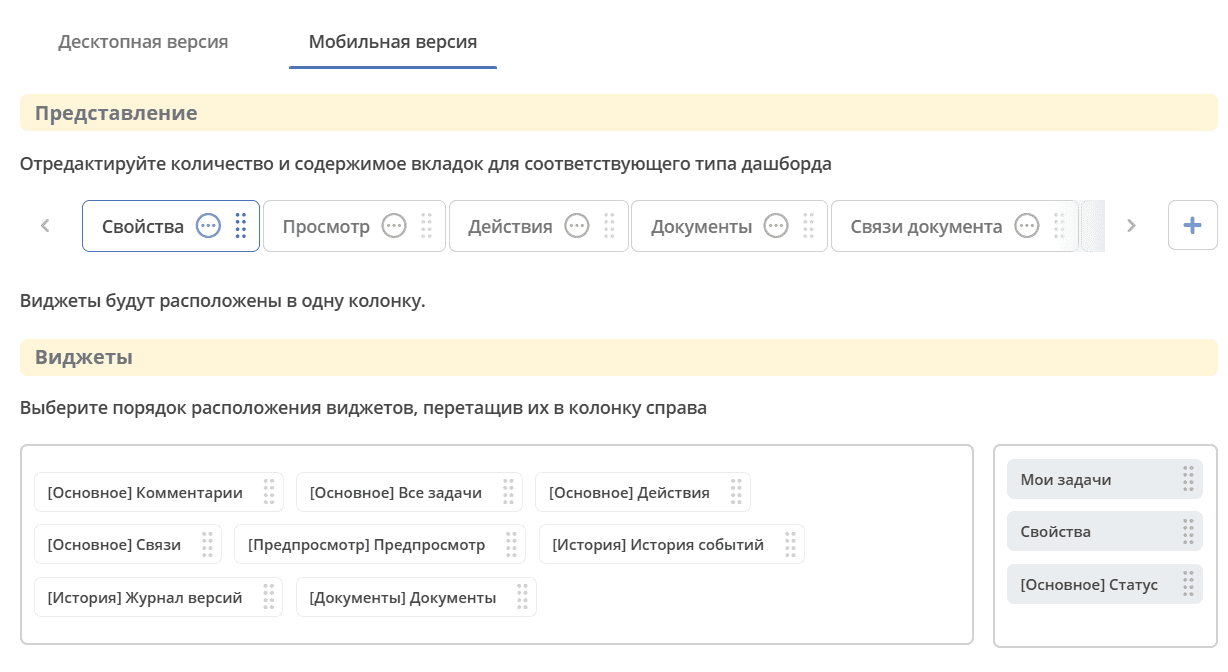
«Widgets»
Created columns can be filled with available widgets - drag the widget to the desired column:
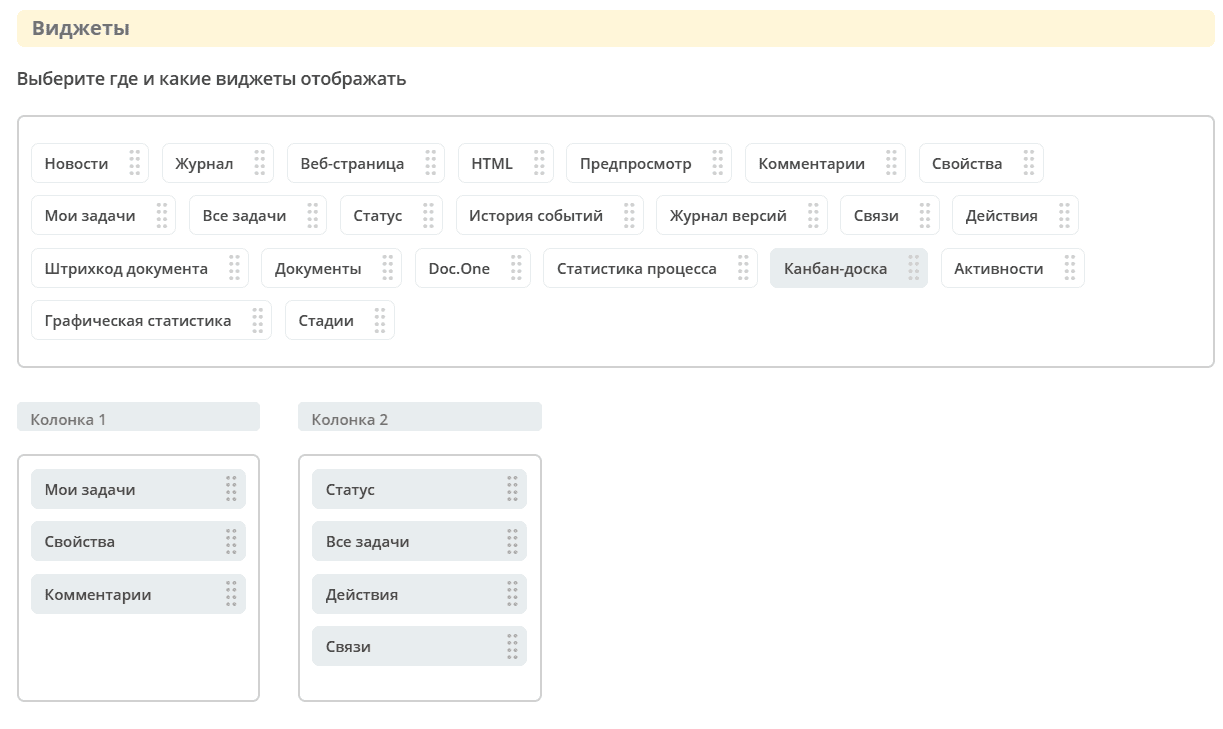
The set of available widgets depends on the dashboard type.
Widget settings on dashboards
Widget configuration is done in each widget’s card. See separate article Widgets
Information about widget availability is stored in the widget itself (without server involvement).
In the widget configuration, the config.widgetDisplayCondition field sets the condition as a json-string. Condition writing according to the article Predicate Language
If no condition is present, the widget is displayed.
Journal “Dashboards”
The journal is located in admin section -> UI Configuration -> Dashboards:
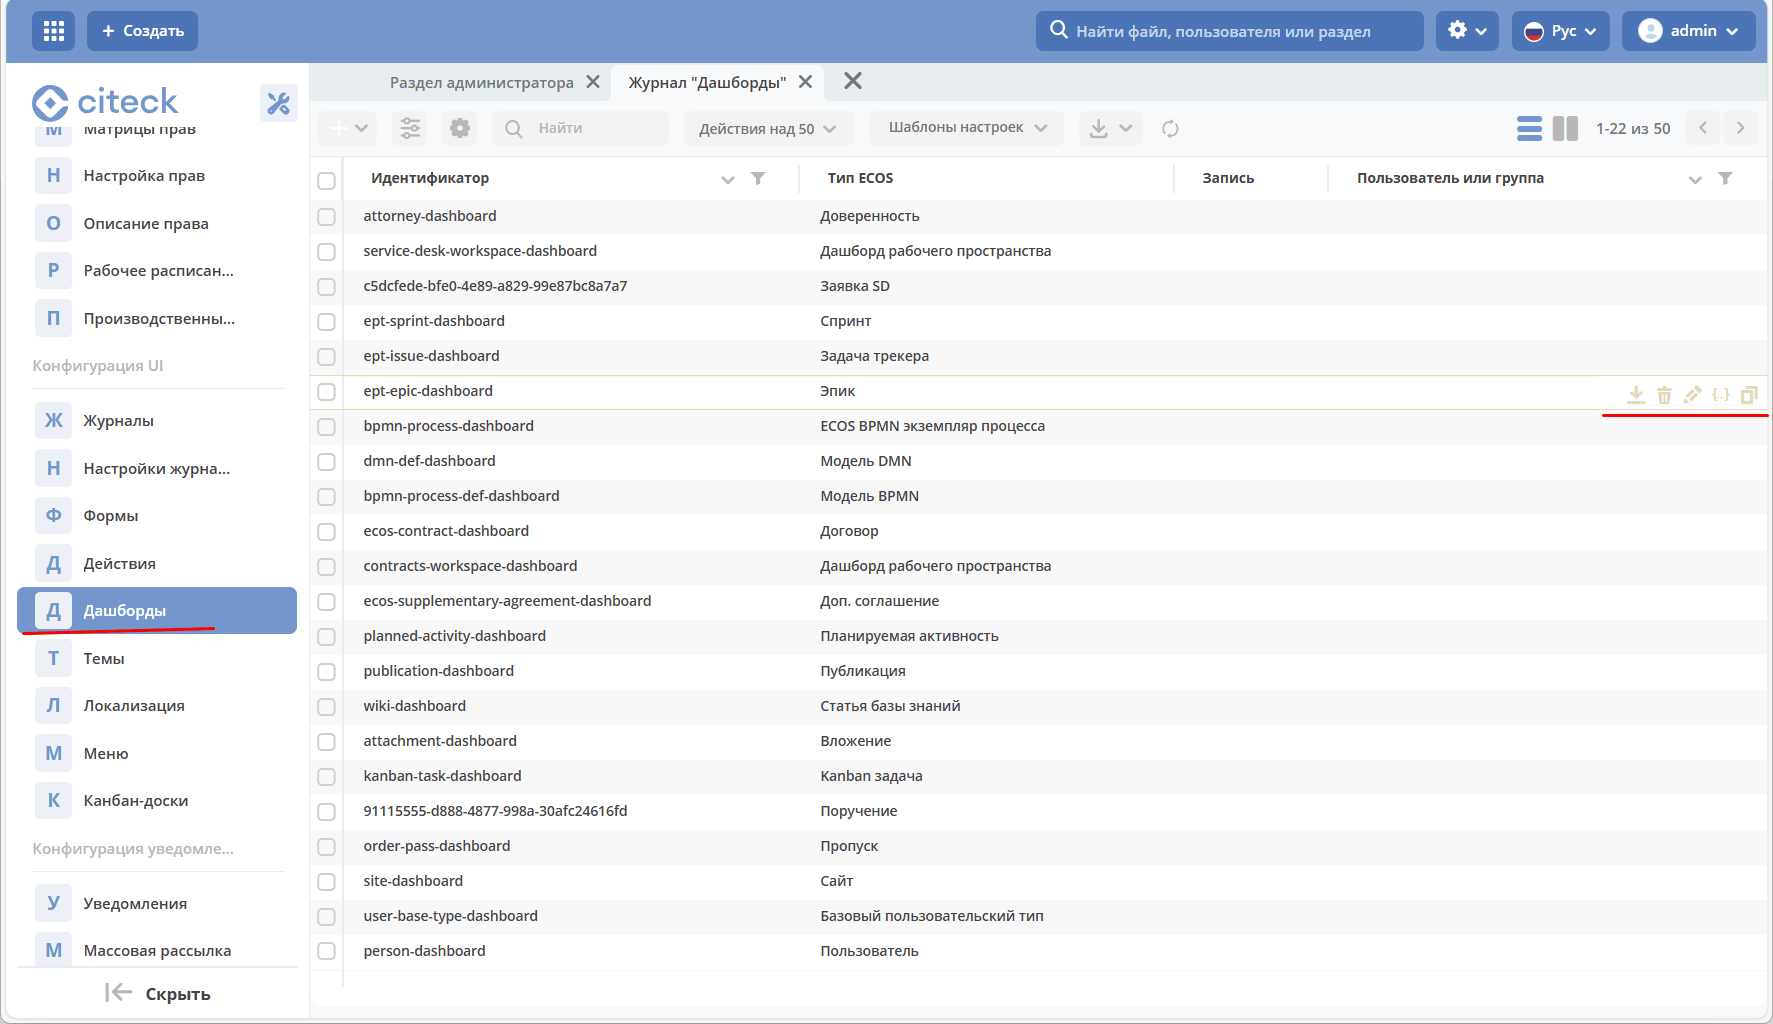
The dashboard can be downloaded, deleted, edited in the form or via json-file, copied.