Widget “Gantt Chart”
The Svar React Gantt library was used in development.
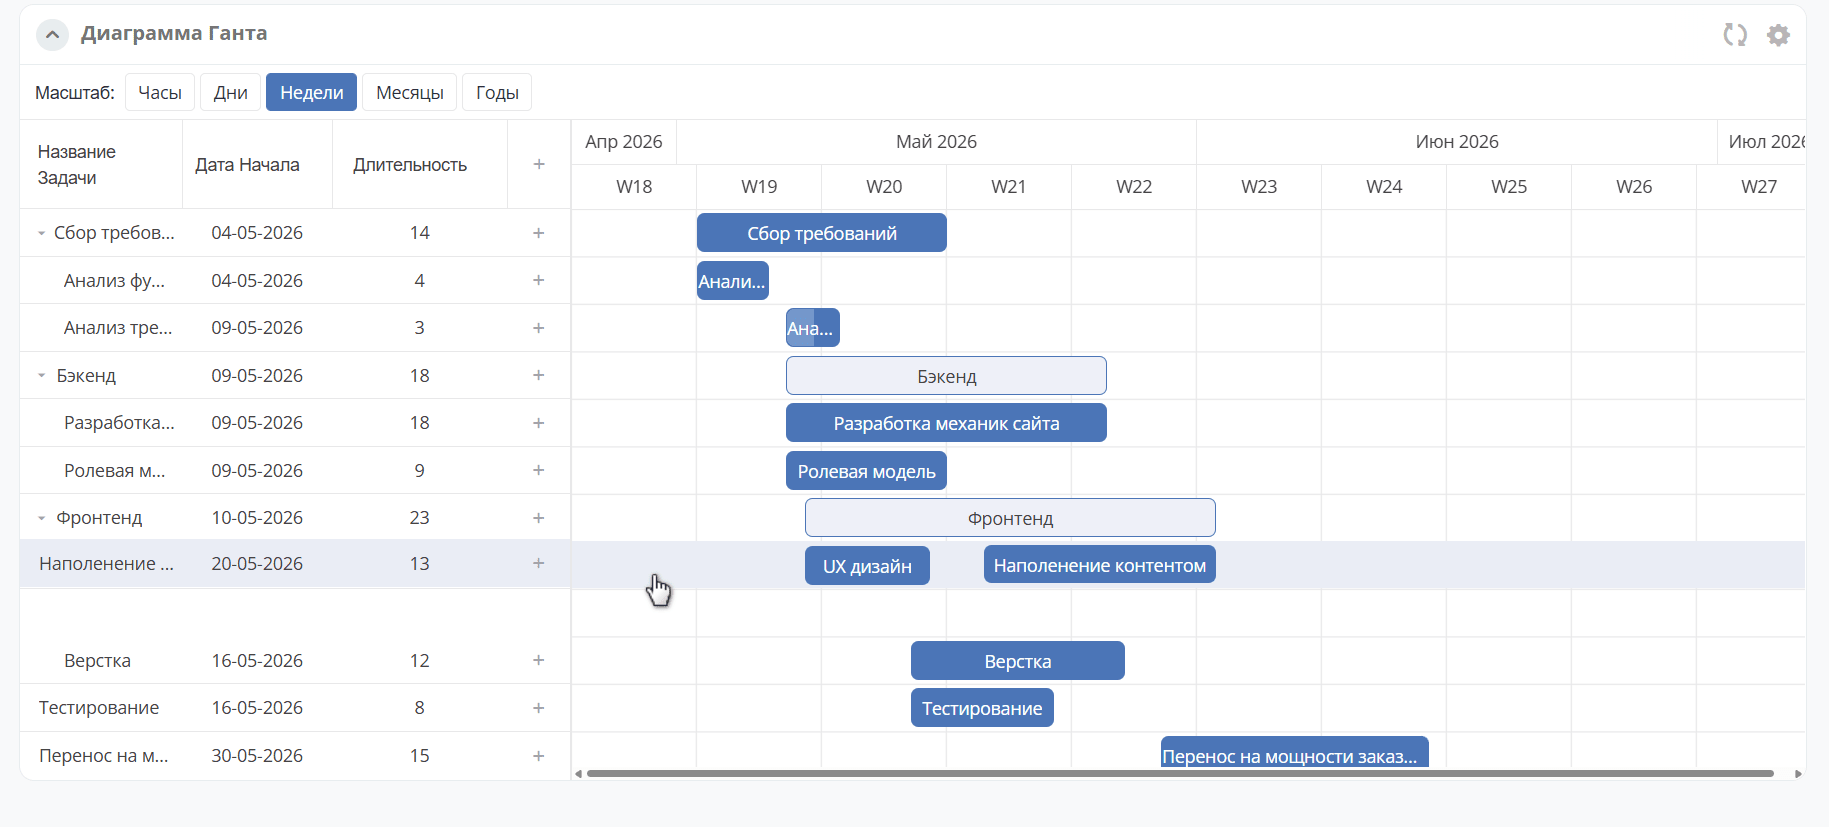
Диаграмма Ганта – инструмент визуализации временной шкалы проекта, включающий задачи различных типов. Диаграмма включает в себя следующие ключевые элементы управления:
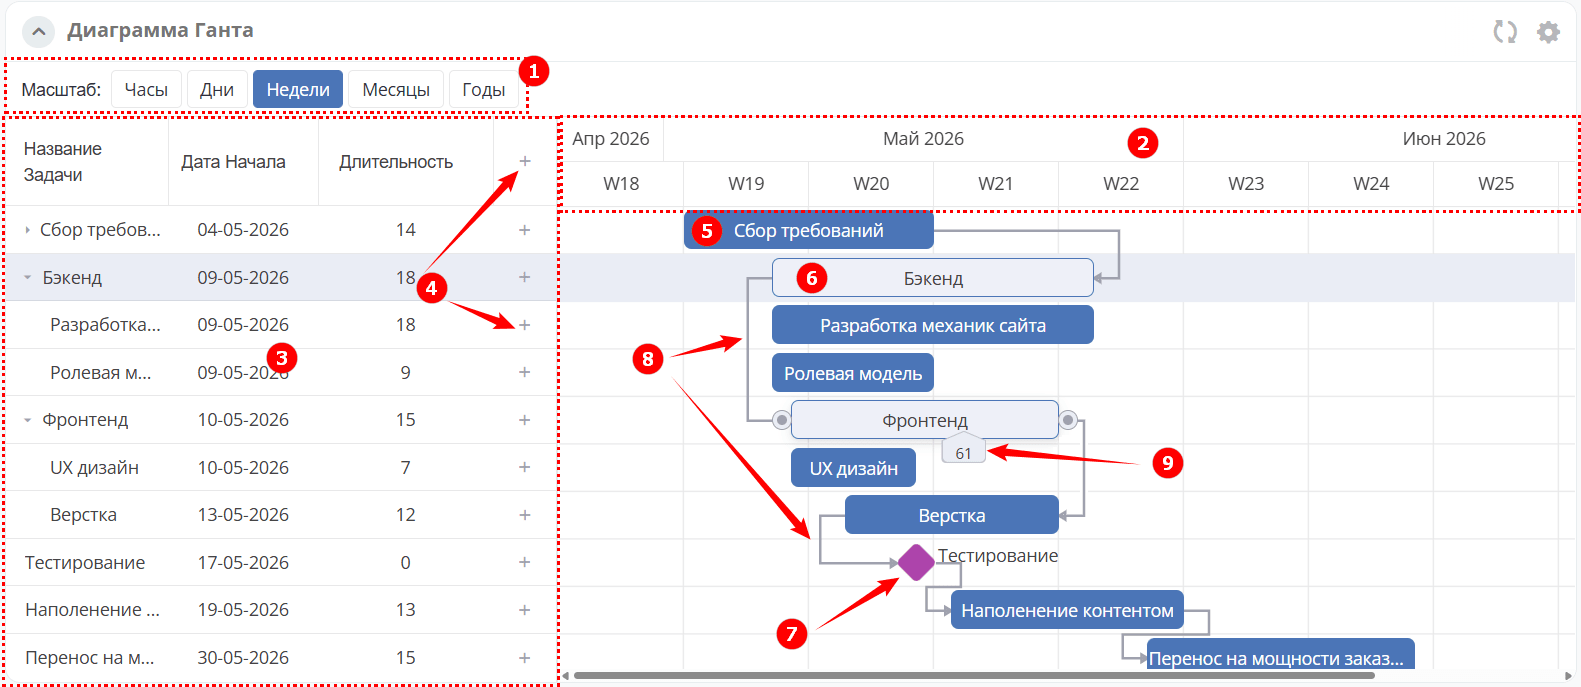
1 – view scale
2 – timeline
3 – task list
4 – task creation buttons
The chart contains the following objects:
5 – phase
6 – task
7 – milestone
8 – links showing dependencies between tasks
9 – task completion progress in %
Configuration
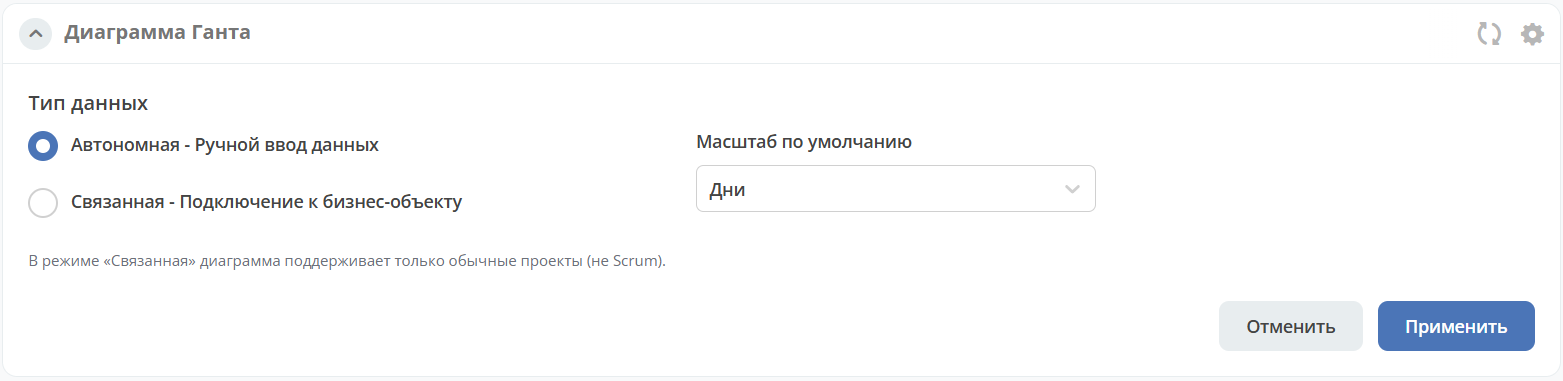
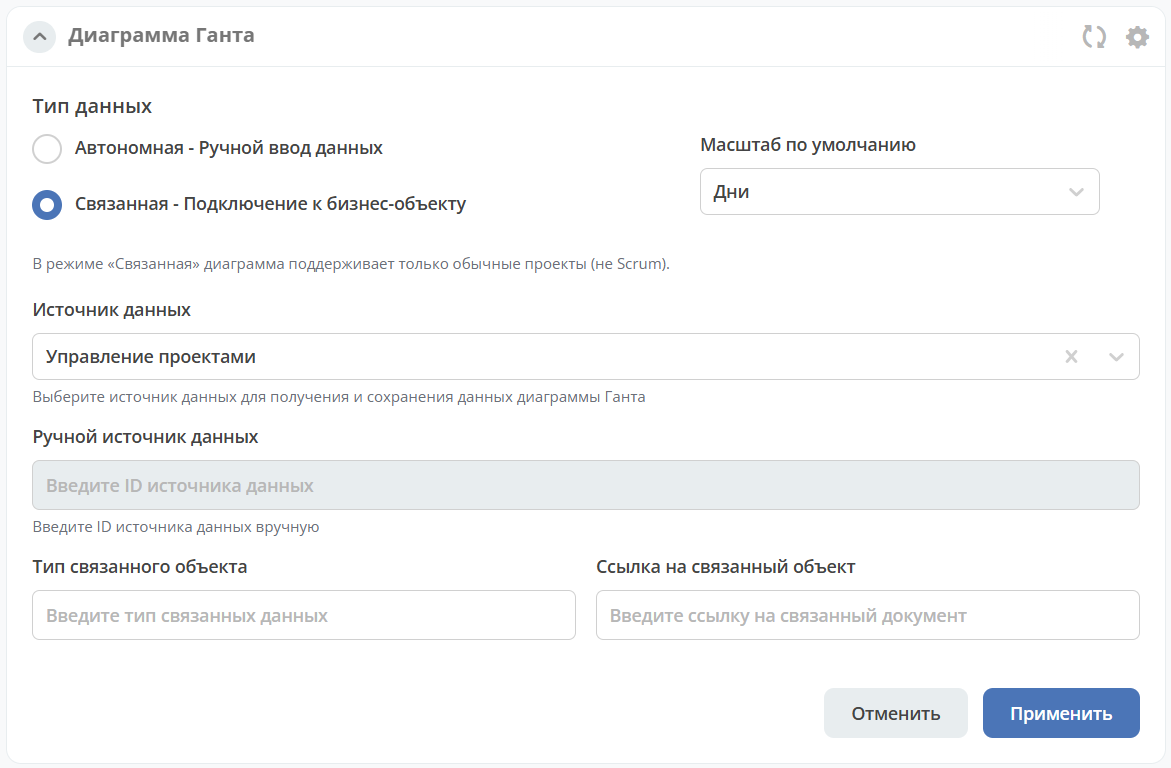
The Gantt chart settings include:
Data type:
Standalone — Manual data entry for Gantt chart elements.
Linked — Connect to a business object. Currently implemented using data from a simple project.
Default scale — the scale displayed when the Gantt chart is opened. Available options: hours, days, weeks, months, years.
Task types
By default, the Gantt chart has three task types:
Task – a general task. It has a rectangular shape and is usually included in a phase.
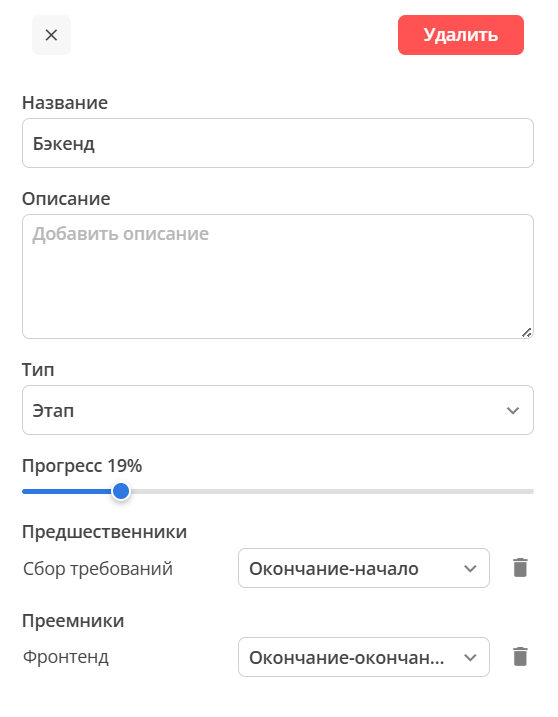
Phase – a group of tasks, milestones, and other phases.
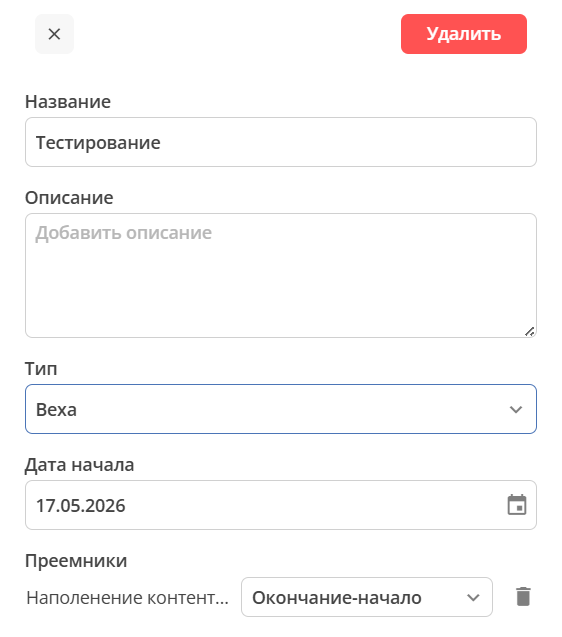
Milestone – a diamond-shaped marker denoting an important point in the workflow. Milestones have no duration or progress, so only a start date can be specified.
The bar color indicates the task type.
Fields for different task types:
Task management and manual data entry
The Gantt chart allows you to add tasks, edit and delete phases, tasks, and milestones, as well as convert one task type to another.
Add a task
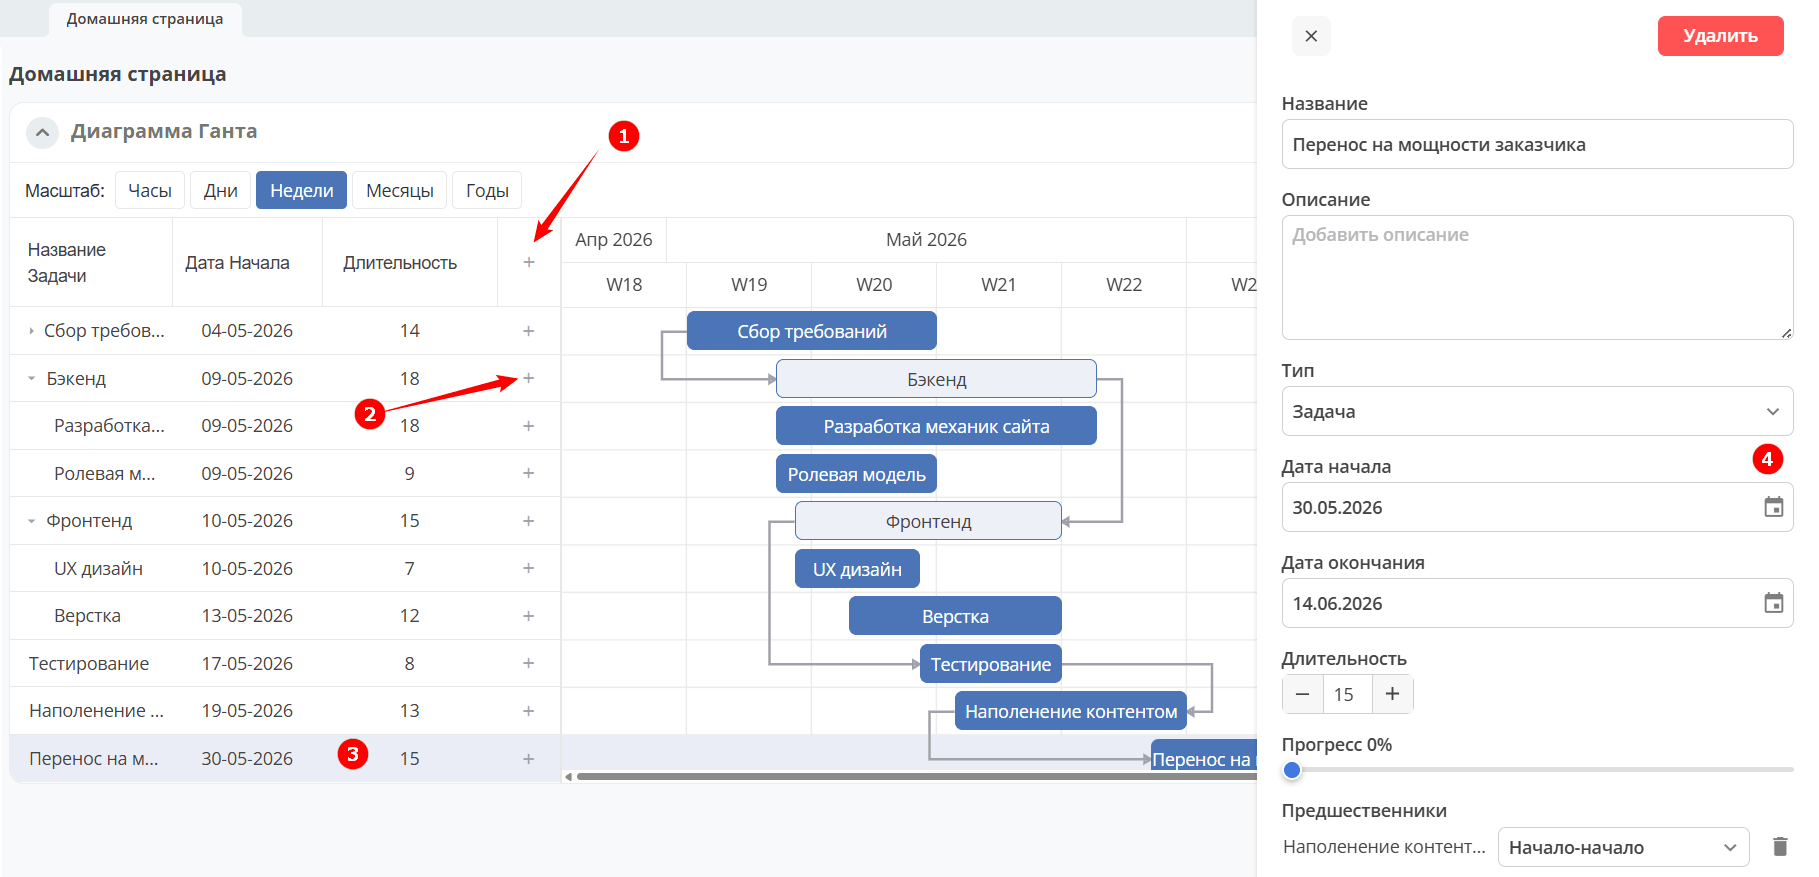
To add a task, click (1); for a subtask, click (2). The task will be added to the list.
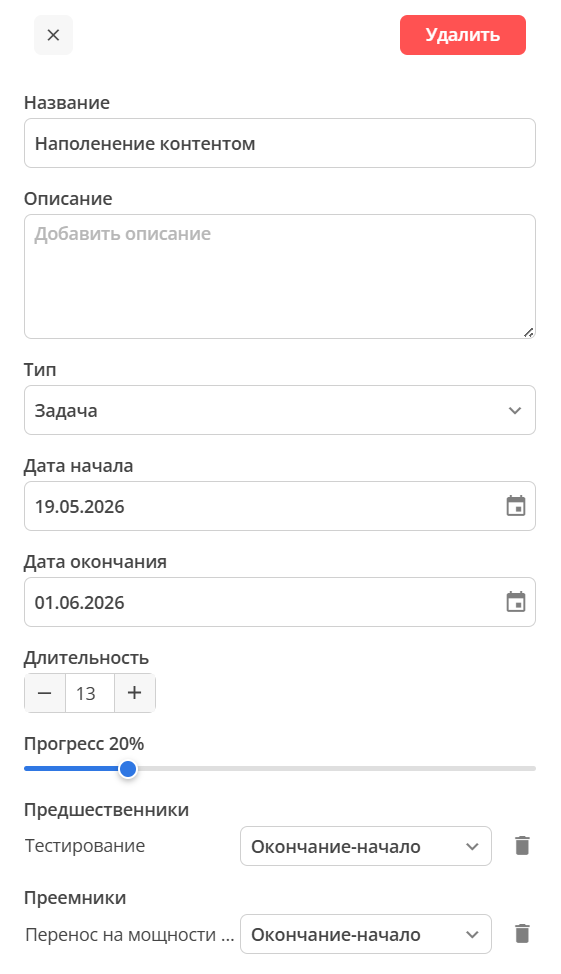
To fill in the details, double-click the task (3). In the panel on the right, fill in the task fields (4).
Edit, delete
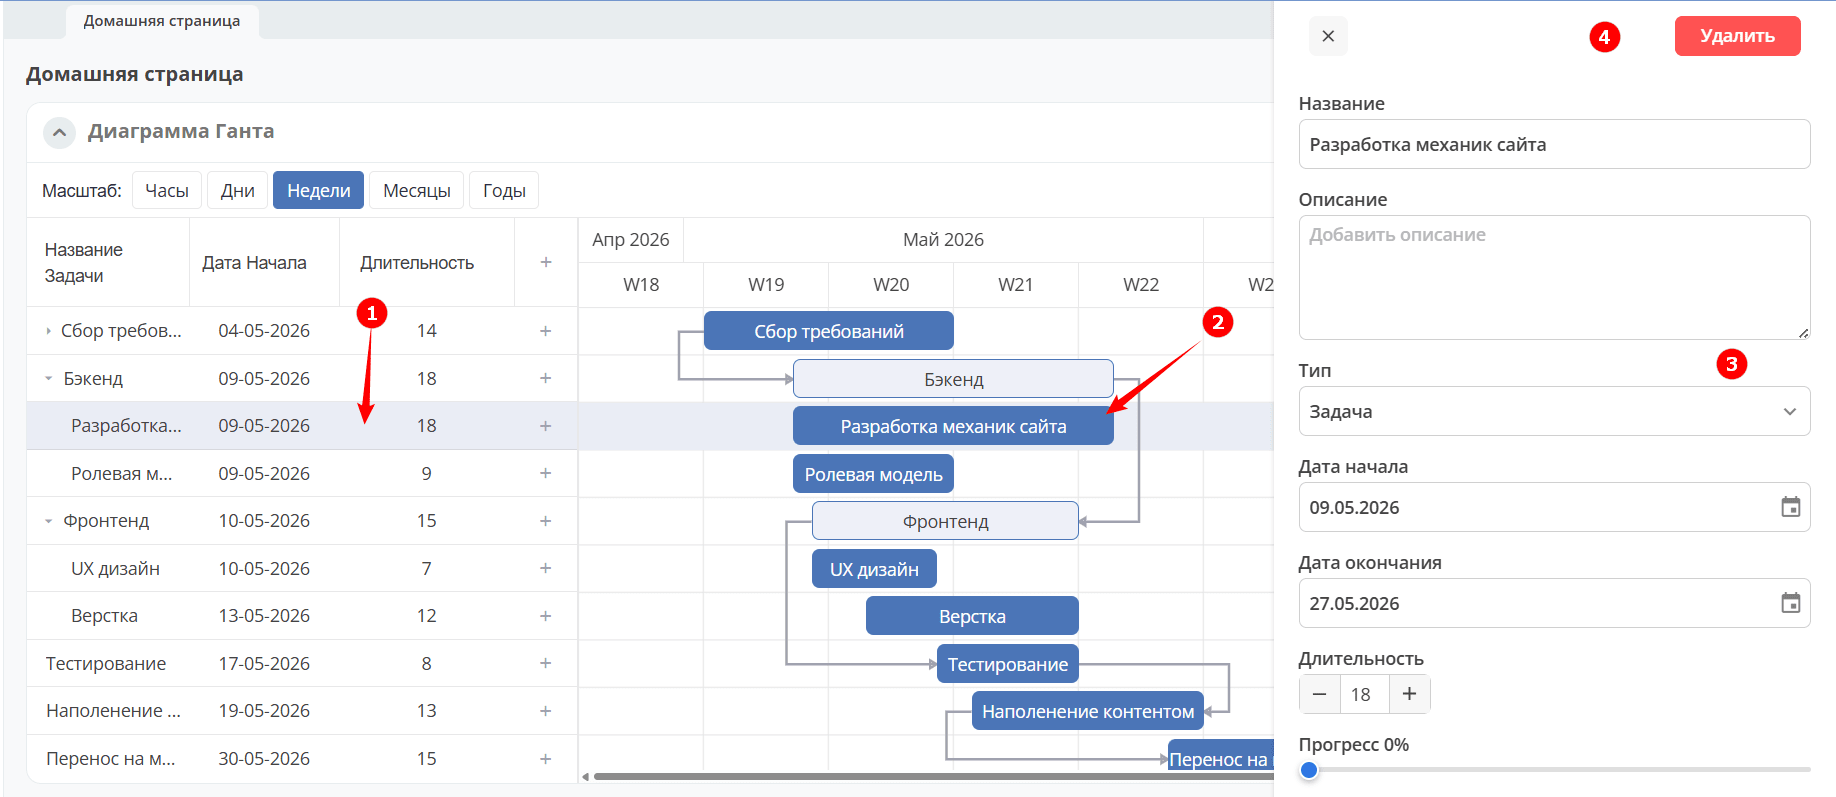
Double-click the required task (1) in the task list or the chart element (2). In the panel on the right, edit the task details (3) or delete it using the corresponding button (4).
Convert one type to another
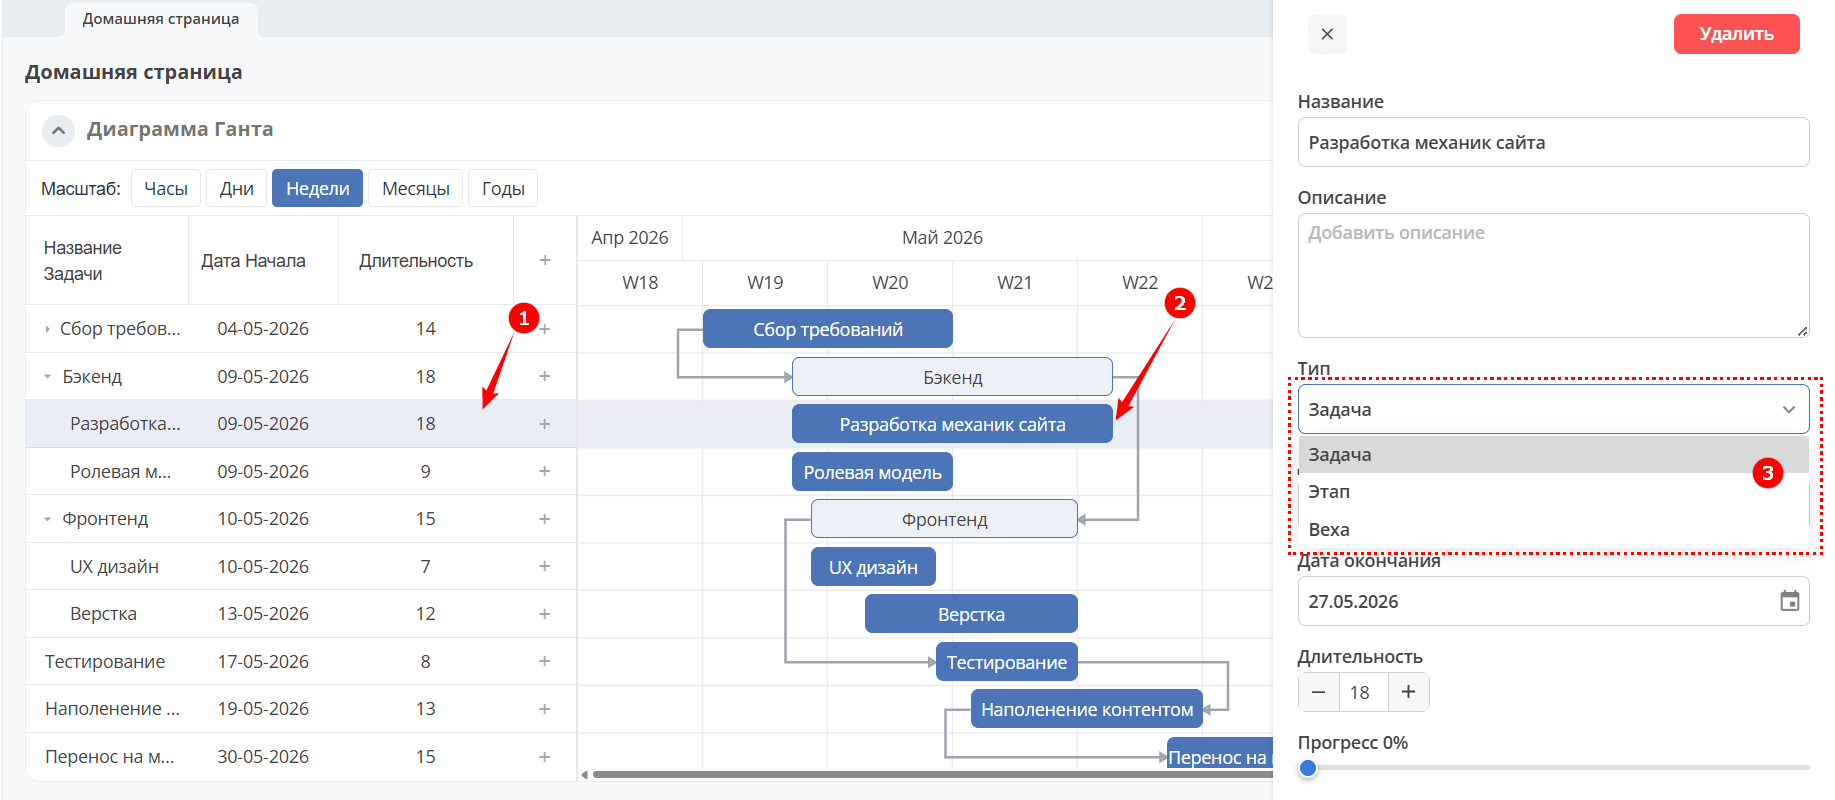
Double-click the required task (1) in the task list or the chart element (2). In the panel on the right, select the Type from the dropdown list:
Change dates
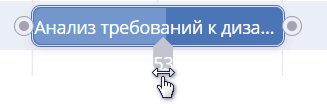
To change the task start date, drag it by its central part along the horizontal timeline.
To change the start or end date of a task, drag its leftmost or rightmost edge (the area is indicated by a resize cursor).
Note
A phase duration cannot be changed. Its start and end dates cannot be modified independently. A phase can only be dragged together with its child tasks.
That is, if a phase is moved, all its child tasks are also moved. If a child task is moved to start before the phase start date, the phase start date changes accordingly. If a child task is moved to end after the phase end date, the phase end date changes accordingly.
You can also change dates when editing a task.
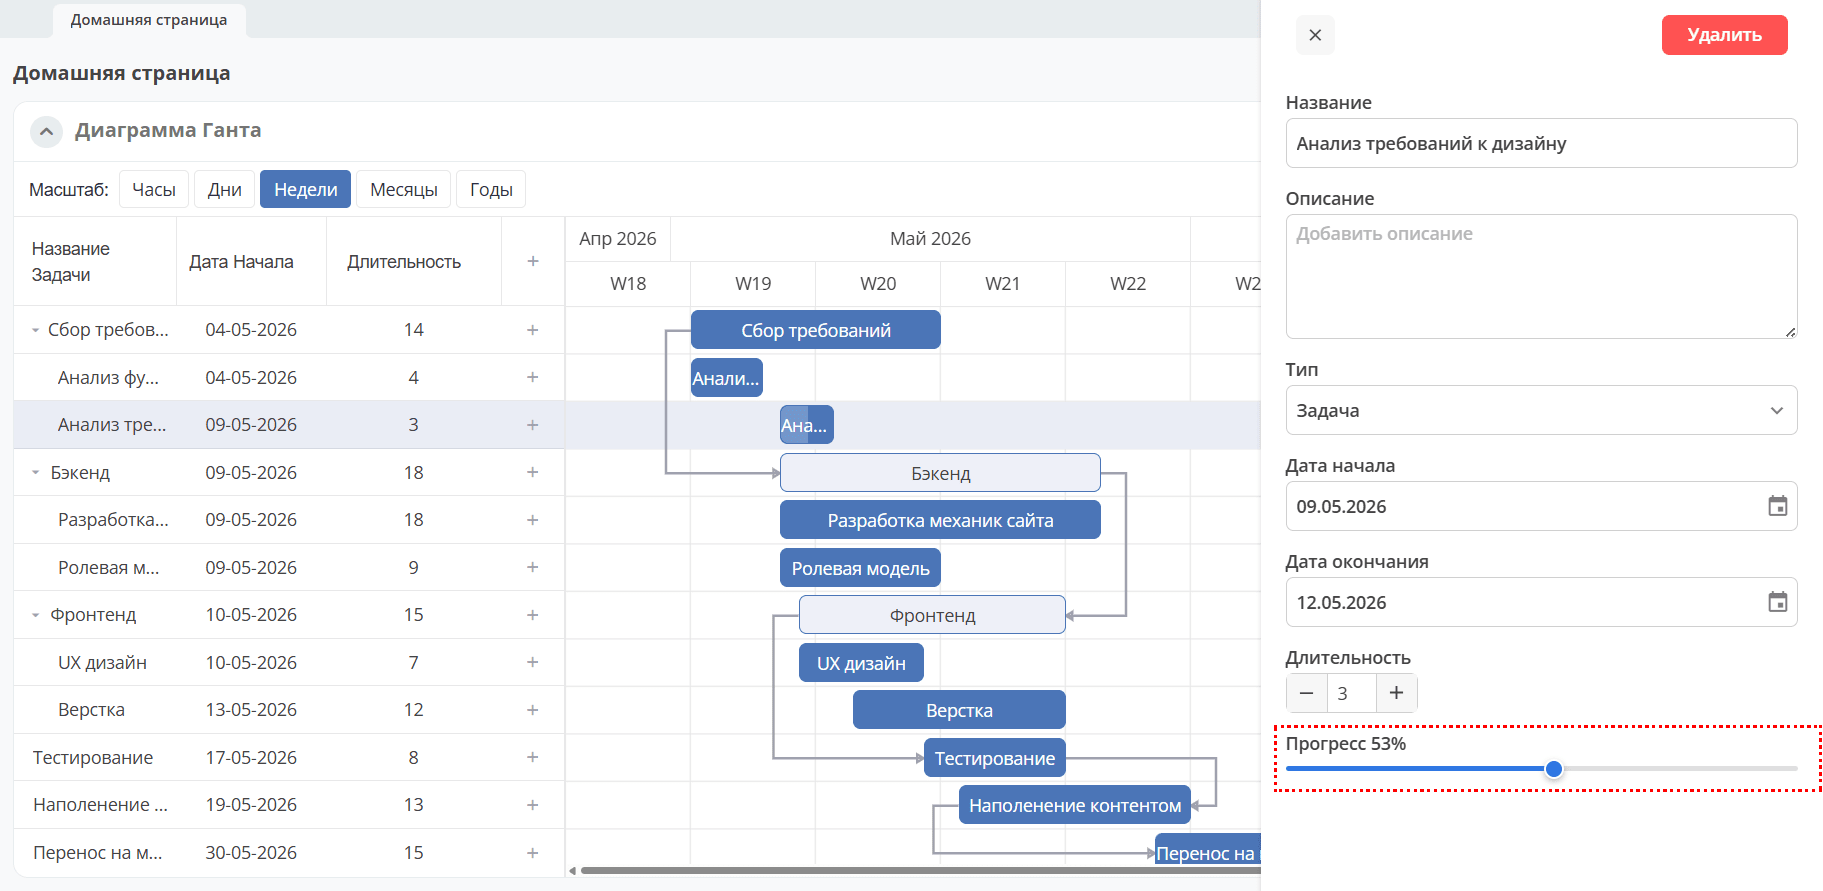
Completion progress
The completion progress is displayed as % for tasks and phases (not milestones). It can be changed by dragging the progress handle on a task or phase:
You can also change the progress in the “Progress” field when editing a task.
Moving and reordering
To reorder tasks, both nested and non-nested, select a task in the task list and drag it to the desired position.
Adding a link
There are 4 types of links between chart elements:
Finish-to-Start
Start-to-Finish
Start-to-Start
Окончание-окончание
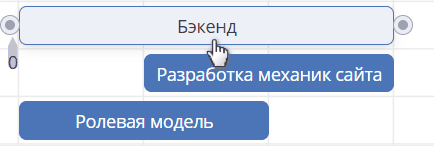
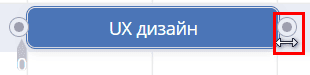
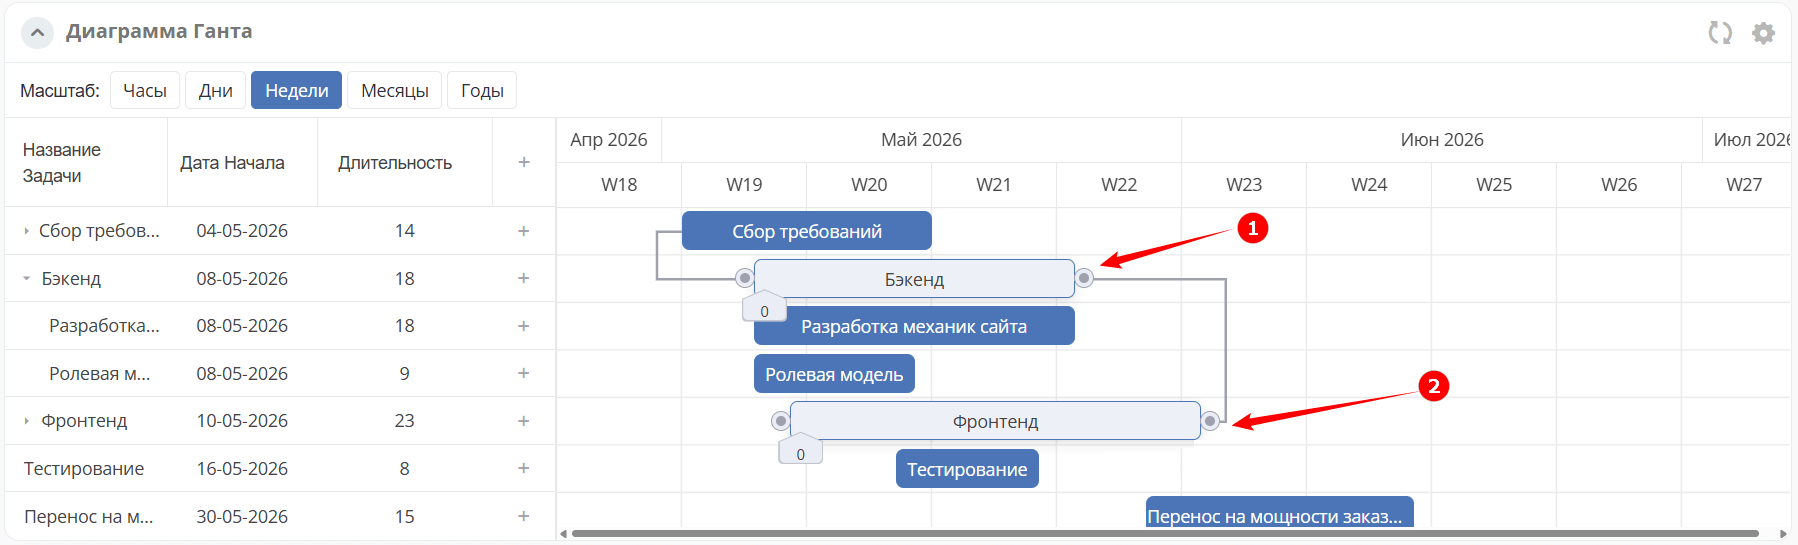
To create a link between elements, click the round handle on the source element (1), then click the handle on the target element (2).
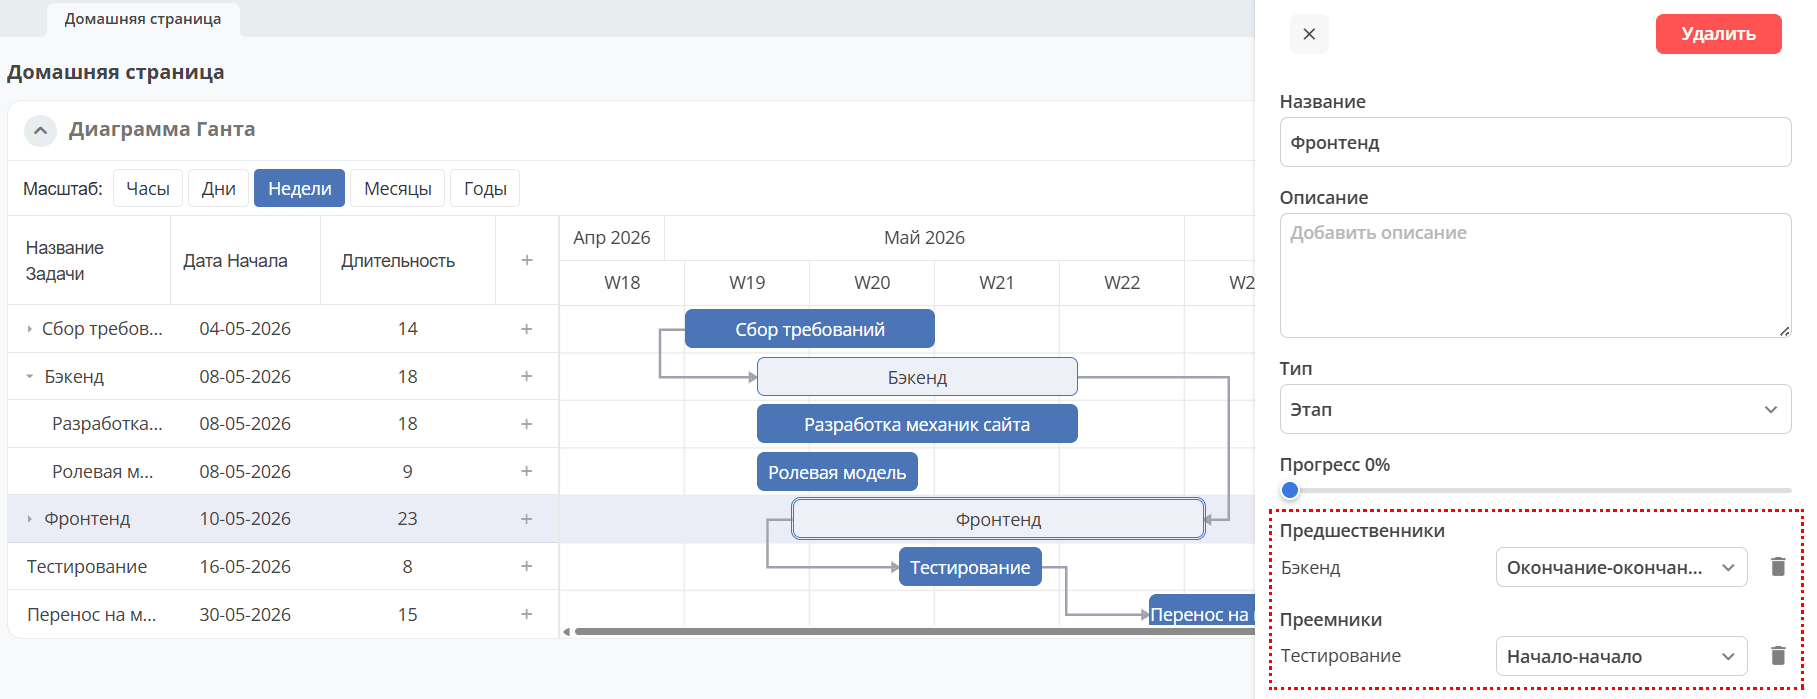
You can also change existing link types in the “Predecessors” and/or “Successors” fields when editing a task. To delete a link, click the “Delete” button next to the link type.
Adding a Gantt Chart to a Project
A Gantt chart can be added to a simple project.
Navigate to the project workspace and add the Gantt Chart widget in the page settings.
In the widget settings, select Data type - Linked - Connect to a business object.
In the Data source field, select Project Management.
Project tasks and phases will be displayed on the Gantt chart.